Depending on where you are in your marketing journey, digital marketing is either a voodoo-like superstition or a teachable science anyone can master. If you’re in the former camp, you’re probably struggling to master your metrics; measuring results is the difference between wishful thinking and actual return on your marketing investment.
To be sure, there are literally hundreds of numbers, statistics, and analytical combinations you could track to give you insight into your marketing efforts and customer behasvior, and not every metric is relevant to your marketing plan. That said, there are a few key metrics in three broad categories (traffic, conversions, and revenue) that are universally applicable to judging your digital marketing success. Here are 18 important digital marketing metrics to watch.
Traffic Metrics

Image via Flickr by BlueFountainMedia
1. Total Site Visits
This is the big-picture number you should monitor and track over time to give you a rough idea of how effective your campaigns are at driving traffic. This number should grow steadily over time; if it drops month to month, it’s time to take a hard look at your marketing channels to identify the problem.
2. Traffic by Sources or Channels
This is useful for segmenting your traffic sources to pinpoint which ones are over and underperforming in your overall marketing campaigns. In general, you should break these down into the following four channels/sources:
- Direct Visitors – These are the ones who come to your website by typing your URL into their browser.
- Organic/Search – These are visitors who arrive at your site based on a search query.
- Referrals – These visitors arrived at your side from a link on another website or blog.
- Social Media – If you have a social media presence (and who doesn’t?), you’ll want to measure the visitors who arrive at your site from your social media platforms. Social traffic also gives you some general insight into the overall effectiveness of your content marketing and other digital campaigns, as well, since social traffic is a good indicator of engagement and awareness.
3. Number of New Visitors versus Number of Return Visitors
This is an important distinction to track; return visitors give you an indication of the usefulness and quality of your content—whether it’s “sticky” enough to attract multiple visits. Tracking this ratio week over week and month over month shows you how your new content is performing. For example, if you have a high ratio of new visitors to return visitors compared to a previous month, it’s an indication that new content is doing its job driving traffic, but the rest of your website doesn’t meet the needs of these new visitors.
4. Interactions Per Visit
This is a more detailed analysis of your website traffic, but it yields actionable insight if you know how to interpret it. You’ll want to look at variables such as how many pages a user visits, how long they stay on individual pages, and what they do on each page (leave a review, for example).
Don’t confuse interactions with conversions, although the ultimate goal is to have your interactions lead to more conversions such as downloads, subscriptions, purchases, etc. An analysis of your interactions per visit gives you the opportunity to discover which activities and behaviors are keeping visitors on your site and what you can do to encourage more of them.
4a. Time on Site
This is a corollary to interactions per visit and gives you insight into the level of interest and engagement of your website visitors. This is a good all-purpose indicator of how well your site is performing, since visitors who spend a lot of time on your site are finding useful content. Visitors who spend a lot of time on your site are also most likely to be your most committed customers; knowing where these visitors spend their time interacting with your site helps you optimize content for these customers to increase their lifetime value.
5. Bounce Rate
The bounce rate is the number of people who visit your site and leave right away without performing any meaningful action. A high bounce rate can point to several flaws in your digital marketing: Poor campaign targeting, irrelevant traffic sources, weak landing pages, etc.
If you have an e-commerce site, your bounce rate is synonymous with the abandonment rate and this usually indicates problems with your checkout process. Is pricing transparent? Do you load people up with last-minute offers? Spend some time evaluating how to improve the checkout experience.
6. Exit Rate
This is a helpful metric, especially for websites that have a multi-page conversion process. The exit rate differs from the bounce rate in that the exit rate measures the number of people who left the site from a particular page as a percentage of all people who viewed that particular page. This helps you identify drop-off points in your conversion process so you can optimize accordingly.
7. Mobile Traffic
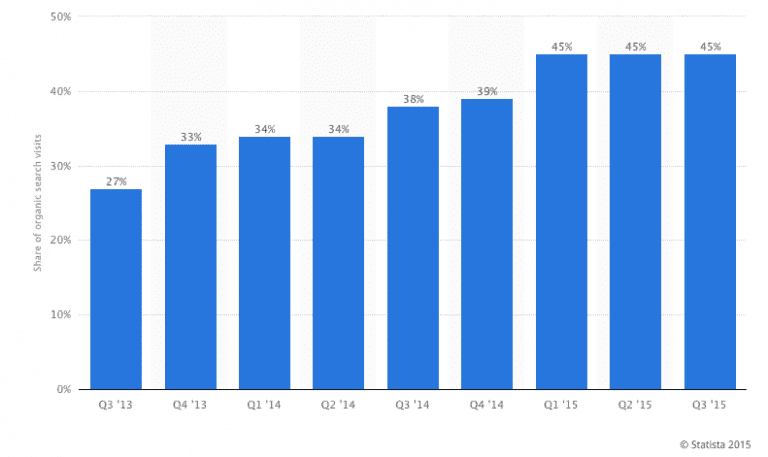
Mobile Share of Organic Search Traffic
With the rise of mobile dominance in content consumption, it’s almost negligent not to track your mobile visitor metrics so you can understand your mobile customers and increase your conversions. Here’s what you need to know:
- What percent of your traffic is mobile?
- What devices and browsers do they use?
- Where are they coming from (direct, organic, referral, social, etc.)
- What content are they consuming?
Finally, you should take a look at your site speed because slow load times actually affects pretty much every one of your mobile marketing metrics, from SEO to conversions.
8. Cost Per Visitor (CPV) and Revenue Per Visitor (RPV)
These broad measurements give you a simple formula for the profitability of each marketing channel: If your RPV exceeds your CPV, you’re on your way. These numbers also help shape your budgets for certain types of paid campaigns.
Take AdWords, for example. Imagine that for a particular month, you attributed 10 sales with a value of $15,000 to your AdWords campaign. During that same period, AdWords generated 1,000 visitors to your site. This means that your RPV for your AdWords campaign last month was $15 ($15,000/1,000=$15). This gives you a hard ceiling ($15 per visitor or less) for your marketing budget in this channel before you start losing money.
Your CPV is calculated by dividing your total investment in a particular channel by the total number of visitors it generated. You should run these numbers for each of your traffic sources (search, social, email, etc.) to give you a rough basis to measure success for each channel.
Conversion Metrics

Image via Flickr by SEOplanter
9. Total Conversions
One way to define conversions is the number of anonymous site visitors who become digital records in your CRM or marketing database, whether by making a purchase, downloading an asset, or subscribing to a mailing list. This is the number your financial department will be most interested in, the ultimate measure of success for a marketer. Low conversion rates are indicative of any number of problems, from poorly designed websites to unattractive offers.
10. “Micro” Conversion Rates
Pretty much all marketers track overall, or “macro” conversions, but to really drill deep into your mobile marketing metrics, it’s a good idea to track conversions at the campaign level, or “micro” conversions, to ensure that these smaller KPIs are contributing to your overall marketing strategy.
For example, if you have very high conversion rates pushing a new lead magnet such as an e-book, but an extremely small number of leads move to the next stage of the funnel, you’ve got a problem. Even though this campaign is posting good metrics, it’s really not advancing your overall marketing goals, and tracking these micro conversions can help you identify the source of the problem.
11. Conversion Funnel Rates
Rand Fishkin, the “wizard of Moz,” considers these metrics one of the three most important overall for digital marketers. He defines them as “knowing the percent of potential customers that make it through each step of a given conversion process, and which channels or behaviors predict that they’ll make it further.” Inherent in this is a deeper understanding of how each stage of the funnel affects your ultimate ROI and where to direct your resources.
12. Click Through Rates
Measuring click-through rates (CTR) is essential for email marketing and paid ad campaigns. For PPC campaigns, a higher than average CTR can dramatically decrease your cost per click (up to 50 percent on AdWords, for example), while a lower than average score can drive costs through the roof (up to 400 percent higher on AdWords).
13. New/Unique Visitor Conversions versus Return Visitor Conversions
The way a new visitor interacts with your website is very different from the way a regular visitor behaves. For many marketers, tracking these numbers yields useful information for reducing your bounce rate and increasing your return visitor rates, conversions, and customer lifetime value through upselling and marketing automation, for example.
14. Cost Per Conversion
Depending on how you define conversion, this can be called cost per lead, cost per referral, etc., but the overall metric is extremely important, because it ultimately determines your margins. Why? A high cost per conversion can turn a high conversion rate into a negative if the costs are so high they drop your net income too much.
15. Lead to Close Ratio
This is a simple metric to compute: Divide your total number of leads by your total number of sales/closes. Although this is more a measurement of your sales efficiency—and you’ll want to investigate a low close rate—you’ll also need it for your marketing ROI projections.
Revenue Metrics
16. Value Per Visit
This isn’t necessarily simply a revenue metric; it’s actually tied to your interactions numbers. It’s also a difficult value to quantify, because your visitors add value every time they come to your site or read your blog (think page views and traffic for cpm advertising). Obviously, in e-commerce, tangible value is added when dollars are spent on a purchase, but intangible value is also created if a customer leaves a review or shares a product on social media.
Many marketers assign an arbitrary value to these customer actions and then calculate a total value, including purchases, for a set period of time. They then divide that number by the total number of visits to arrive at a VPV metric.
Tracking this metric over time gives you insight into how successful you are at getting customers to perform a certain value-added action, such as writing a review, leaving a comment, socially sharing, or otherwise interacting with your site.
17. Cost Per Acquisition
Cost per acquisition (CPA) differs from cost per conversion because CPA is all about revenue; this metric kicks in once someone becomes a paying customer, the Holy Grail of marketing. CPA tells you exactly how many marketing dollars you have to spend to get someone to open his wallet.
Sometimes it’s tempting to focus on metrics like cost per click, which you must track in paid campaigns, but it’s a short-sighted metric. Imagine you’ve developed a new PPC campaign and it seems to be performing well—CTRs are up from previous campaigns and your CPC is lower.
But then you track revenue and discover you’ve only acquired three or four paying customers, meaning your entire marketing spend on that channel added virtually nothing to your bottom line. In this case, your campaign metrics look great, but your CPA is astronomical. Your CPA keeps the big picture always in focus.
18. Return on Investment (Real and Projected)
This is the ultimate measure of your marketing success: Are your marketing technologies and efforts profitable and delivering results to your bottom line? Here’s where your lead-to-close ratio comes into play to help keep you on track. If you’re spending $25 per lead and your closing rate is 25 percent, it costs you $100 to acquire a new customer. If your average customer value exceeds that amount, you’re in the black on projected marketing ROI.
Depending where you are on the digital marketing spectrum, you may or may not want to formally track each of these metrics, but doing so will give you a pretty accurate view of how you’re doing, what channels are effective, and where your efforts need improvement. Ideally, you’ll get into a rhythm that lets you easily identify trends and variances—and make rapid adjustments to ensure a steady stream of leads and paying customers.