On the other side of the spectrum, Android users seem to be late adopters.
Frequently Asked Questions
Why do iPhone users tend to spend more on apps compared to Android users?
iPhone users generally have higher income levels and are more engaged, which leads to increased spending on apps. Platforms like Buildfire can help developers target these high-value users effectively.
How does the app submission process differ between iOS and Android?
iOS has a strict app submission process with guidelines and reviews, while Android offers a more flexible approach without human review. Buildfire, for instance, provides guidance on navigating these processes.
What are the key demographic differences between Android and iOS users?
Android users are more prevalent in developing regions and among lower income groups, while iOS users typically have higher incomes and education levels. Tools like Buildfire allow businesses to tailor their apps to these demographics.
Do personality traits influence smartphone choice?
Studies suggest that Android users are less extroverted and more frugal, while iPhone users are more extroverted and spend more. However, individual preferences vary widely.
How does smartphone choice reflect on technology adoption?
iPhone users are often early adopters and loyal to Apple products, whereas Android users may adopt technology later. This can influence app development strategies.
ters and they are less likely to backup their computer. They prefer a full-featured device at the expense of its appearance, and they are more likely to use Yahoo Mail as opposed to owning an email domain associated with work or their website.
Push notifications behavior
It’s fascinating to see that even actions like reacting to push notifications vary so much between Android and iOS users. This will help you benchmark your open rates better based on the device your user is on!
About 3.5% of Android users open push notifications, while just under 1.8% iOS users open them. One of the reasons for this discrepancy may be the fact that push notifications on Android stay visible on the lock screen until the user actions on them. On an iPhone, they disappear after the first screen unlock.
There’s a chance that this exact difference in features causes iOS users to open push notifications quicker. It only takes an average of7 minutes for an iOS user to respond to a push notification, compared to 48 minutes for Android user. This may indicate a higher quality of interaction when it comes to Apple users.
Acquisition, in-app engagement and retention
Liftoff released an interesting set of data that covers the cost necessary to acquire a mobile user who subscribes to a paid service, as well as the post-install engagement activity.
This data is segmented based on whether the app main goal was registration, reservation, purchase, in-app purchase, or a subscription. Here’s how the cost per acquisition varies between iOS and Android:
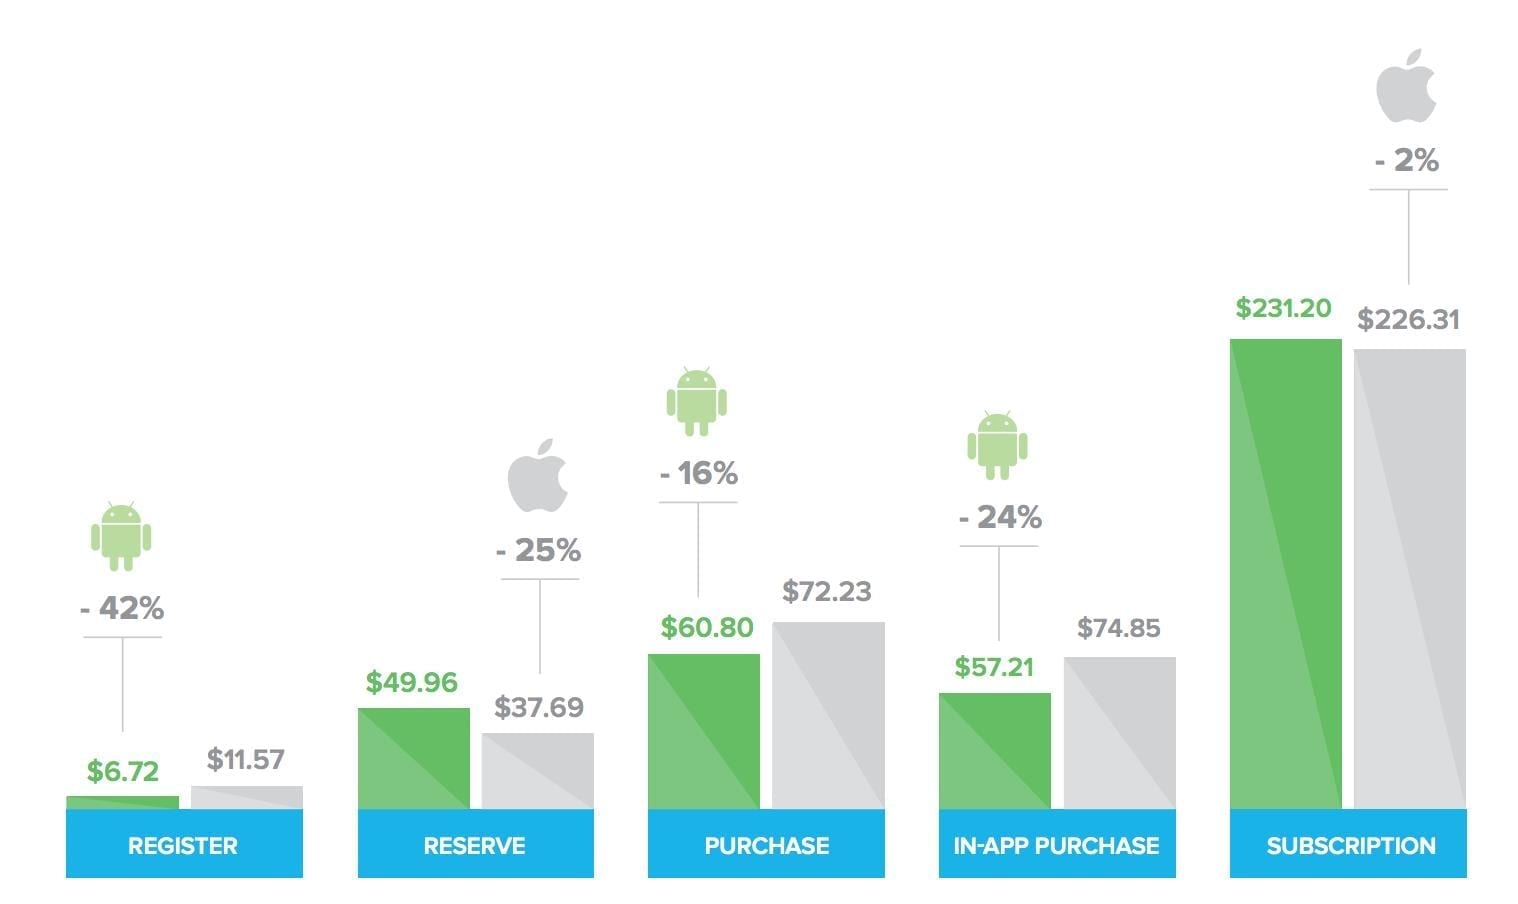
(source: Liftoff 2016 Mobile Index)
| Category | iOS | Android |
|---|---|---|
| Registration | Outperformed by Android | Has a narrow advantage |
| Reservation | Outperforms Android | |
| Purchase | Outperforms Android | |
| In-app Purchase | Outperforms Android | |
| Subscription | Outperforms Android |

(source: Liftoff 2016 Mobile Index)
On average, iPhone users engage with their smartphone apps for nine more hours in a given month than Android users.
iPhone owners are sometimes described as smartphone “power users” and tend to engage with more content on average. On another hand, the Android platform has a greater number of media users in each category.
This means you may want to consider whether audience size or engagement is the more important determinant of success for your app. Which one means more to you: a higher number of users, or the users that engage more? A lot will depend on the goal you set for your mobile app.
Consumer spend and mCommerce
As I mentioned earlier, there seems to be a gap between the purchase power of an average iPhone user compared to an Android user.
The median iPhone app user earns $85,000 per year, which is 40% more than the median Android phone user with an annual income of $61,000. And even though Android has far more downloads than iOS, iPhone users spend twice as much as their Android counterparts. Also, in Q1 of 2017, iOS spending jumped 45% year-on-year, while Android’s grew 40%.
The average in-app shopping check is four times higher for an iOS user! If you’d want to develop a mobile shopping app, iOS development would make all the sense. However, Android users love digital utility apps like launchers, anti-virus apps and performance boosters, and they are ready to pay for those and spend on them 5 times more than iOS users.
iPhone owners are also more likely to make purchases on their phones on a regular basis. These are important considerations for both retail app developers and those seeking to monetize via paid apps or in-app purchase. Mobile ads are the main source of revenue generation in Android apps.
Loyalty to a specific platform
When compared to the Google Android user base, iOS users are more loyal and have more spending power. As I touched on briefly earlier, Android users love the openness of the platform and they like to customize their device, while iOS users like to keep their devices straightforward and spend more time on trying out various apps.
It seems that iPhone owners tend to think very highly of their devices, and are likely to remain iPhone users over time as a result of that. And while the percentage of highly satisfied Android owners is fairly high – 48% – it is quite below the 62% of iPhone owners that feel the same about their smartphone.
When to choose which one
With the growth of both Apple’s App Store and Google’s Play Store, the ideal development path you can take is hybrid development for both platforms. The majority of apps can work perfectly across both, and it’s easier to build that way upfront, instead of building for one app store and adding the other one over time.
If you’re set on choosing one platform over the other, however, keep the following in mind:
- Developing for Android makes sense if your target audience is significantly focused on Android, as well as when you’re focusing on customizing Android user experience and adding to the personalization power that Android has
- iOS first makes sense when your goals align with the consumer spend, high in-app engagement and loyalty that makes iPhone users valuable; Apple has also reduced approval times and the time to market is working to your benefit
Hopefully, this data gave you some insight into your current and/or future app audience. With some significant differences that we covered, you can now look at your engagement rates, in-app behavior and your success measurement with more insight into what lies behind your user’s actions.
Which differences do you find the most relevant to your currentor future app development? Let us know!
Frequently Asked Questions
What is the best programming language for app development?
The best programming language depends on the platform and the specific needs of the app. Popular choices include Java, Swift, and Kotlin.
How long does it take to develop an app?
The time it takes to develop an app can vary greatly depending on its complexity, ranging from a few weeks to several months.
What are the costs associated with app development?
App development costs can vary widely based on the app’s complexity, features, and the development team’s rates.
How can I ensure my app is successful?
To ensure app success, focus on user experience, conduct thorough testing, and implement effective marketing strategies.
What are the key features of a successful app?
Key features include a user-friendly interface, fast performance, and unique functionalities that meet user needs.