Developers aren’t perfect. Even the best developers in the world commit mistakes when they’re developing iOS applications—it happens.
These coding mistakes can lead to all kinds of problems that can ultimately affect the user experience and sometimes impact the core functionality of your app.
That’s why debugging is such a crucial part of the software development lifecycle as various tests are being run. Eliminating bugs is crucial for all applications—not just mobile apps running on an iOS device. App debugging is equally as important for Android apps, web apps, macOS, and any other type of software.
But this guide is going to specifically focus on Apple. You’ll learn exactly how to use a debugger to test and debug your code. Let’s dive in.
Key Takeaways
- Importance of Debugging: Debugging is essential for maintaining app functionality and user experience.
- Focus on iOS: This guide specifically addresses debugging for iOS apps using Apple tools.
- Tools Required: Xcode is the primary IDE for iOS app development and debugging.
- Debugging Process: Involves setting up projects, configuring tools, and fixing bugs.
- Live Testing: Debugging can be done on live devices or simulators.
What’s Involved With the iOS App Debugging Process
iOS debugging all starts with finding the right tools to help you out. Manually trying to go through your code to look for errors isn’t realistic, efficient, or scalable. You just need to configure your debugging tools for different iOS versions and devices.
Xcode is one of the best ways to develop, test, and debug apps. Apple created this IDE (integrated development environment) specifically for developing and troubleshooting iOS apps, so it comes with plenty of built-in solutions to assist with the process.
You can debug your app on a live device, like an iPhone or iPad, or use a simulator on your Mac to test the codebase.
Here’s a brief overview of what you can expect during a typical debugging process:
- Setting up your project to test
- Configuring your debugging tools
- Setting a breakpoint for testing
- Use a running application with a breakpoint
- Find the bugs and fix the issues
We’ll expand on these concepts in greater detail below.
Debugging an iOS App With Xcode
As previously mentioned, Xcode is Apple’s official IDE. To learn more about Xcode and how it works, check out our beginner’s tutorial on how to code Xcode for more information.
If you’re using Xcode to create an app for the App Store, it only makes sense to handle your app debugging directly in this platform. Once the platform has been set to run within the app while testing, the navigator lets you look through everything to check the current state of the app for testing and debugging.
Here’s a glimpse of Xcode’s debug navigator, source code editor, and debug area in action.
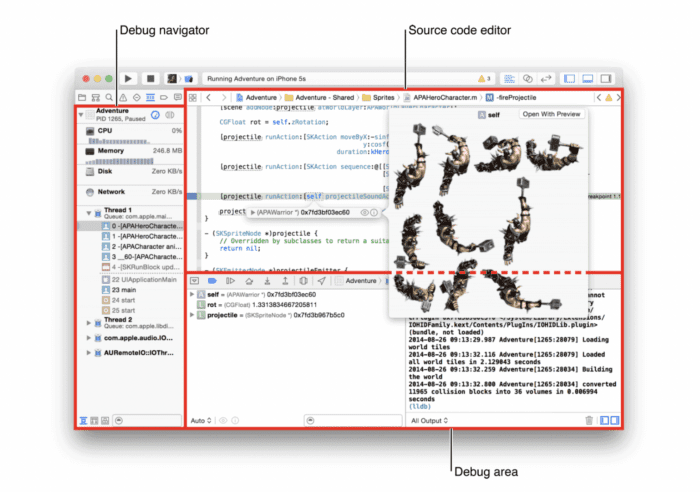
This will ultimately give you insights into more than just code errors. You can use the navigator to see information on resource consumption, app performance, and other things that might impact the iOS device.
Setting the Breakpoint
Setting the breakpoint is a critical step in the iOS debugging process. This is another instance where using the right developer tools will make your life easier.
Every iOS developer needs to understand how this works, which we’ll discuss in greater detail below.
What Are Breakpoints in Xcode?
Breakpoints in Xcode make it possible to pause your app when you’re running the debugger. This allows you to inspect different variables as you’re trying to isolate and locate bugs, crashes, and other errors.
Adding a breakpoint in Xcode is easy. Just navigate to the line within your code where you want the execution to pause. Then click the line number to set the breakpoint.
You can drag it up, down, or away from the gutter to remove it completely. Selecting the breakpoint icon in your toolbar debugger will activate or deactivate all of the breakpoints in your source editor.
If you have several breakpoints across multiple source code files, you can use the breakpoint navigator to manage all of them in one place.
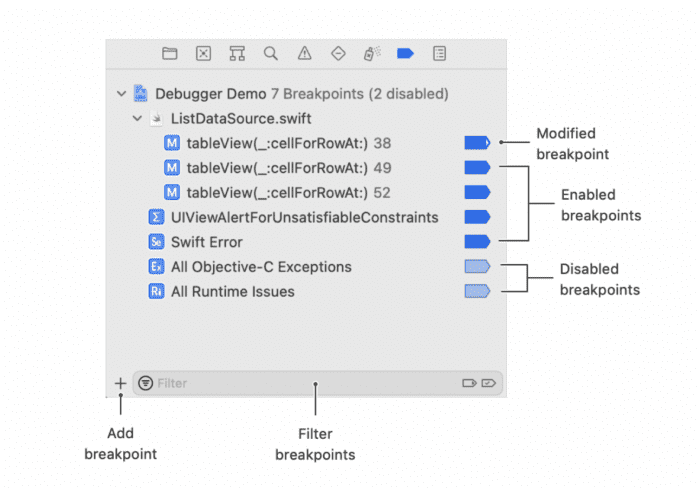
From here, you can:
- Navigate to a breakpoint in the source editor
- Remove a breakpoint from the code
- Enable breakpoints
- Disable breakpoints
- Find frequently used breakpoints
- Specify conditions for pausing the app
How Do Breakpoints Work in Xcode?
Breakpoints work by patching the code you’re executing with specific instructions to trigger an event. When you run an exception breakpoint in Xcode, the default will break on C++ and Objective C—pausing the app during the debugging process and taking you to where the problem lies in your code.
Once you accept the defaults, you can re-run the app and force the error. The debugger should highlight the code that’s causing the problem, so you can isolate and fix any issues.
Can You Debug iOS Apps On An iPhone?
You can debug iOS apps directly on an iPhone. You just need to connect the iPhone to your Mac with Xcode installed, and configure all of the permissions to run the app on a real device instead of on a simulator.
Here’s a quick summary of iOS debugging on an iPhone:
- Connect your iPhone to your Mac.
- Open Xcode and navigate to the Run Destination Menu on the toolbar.
- Select the connected iPhone when prompted to choose a device.
- Xcode will automatically install the app and attach the debugger.
If there are any problems with your code, you’ll see error messages and warnings in your Xcode issue navigator.
What Are the Benefits of Debugging an App?
Using Xcode to debug your iOS app is a critical part of the testing stage. It has a direct impact on the success of your app and its usability. Some of the key benefits include:
- Saves time and money during the development process.
- Developers use troubleshooting opportunities to learn from mistakes in their code.
- When apps are tested at different stages of development, you can identify errors before the release.
- Using a debugger improves the quality of your app for users to enjoy.
- Apps with a smooth UX have a chance to generate more revenue.
Don’t take shortcuts during the debugging stage. It’s important for you to take this seriously to truly get the benefits listed above.
Conclusion
I hope this tutorial on how to debug an app provided some clarity for you as you’re going through this process. Whether you’re creating an app for Apple or Android, debugging is a crucial step in ensuring your app’s success.
g is an essential stage in the app development lifecycle.If you’re still a bit intimidated by native app development and debugging on your own, Buildfire might be the perfect solution for you.
You can use Buildfire’s no-code app builder to make an app without writing a single line of code—meaning no debugging is necessary. Alternatively, you can go with the full-service app development route and let us build the app for you. We’ll handle everything, so you can be free to work on other aspects of your business.
s.Frequently Asked Questions
How can I debug an iOS app on a real device?
To debug an iOS app on a real device, connect your iPhone to your Mac, open Xcode, and select your device from the Run Destination Menu.
Can I use simulators for iOS app debugging?
Yes, simulators are a great way to test and debug iOS apps without needing a physical device.
What are breakpoints in Xcode?
Breakpoints in Xcode allow developers to pause the execution of their app to inspect variables and isolate bugs. This is crucial for identifying and fixing issues in the code.
Why is debugging important in app development?
Debugging is crucial as it helps identify and fix errors or bugs in the app, ensuring smooth functionality.