Key Takeaways
- Continuous Improvement: Regular updates and maintenance are crucial for app success.
- Metric Tracking: Monitoring app metrics helps in assessing performance and user engagement.
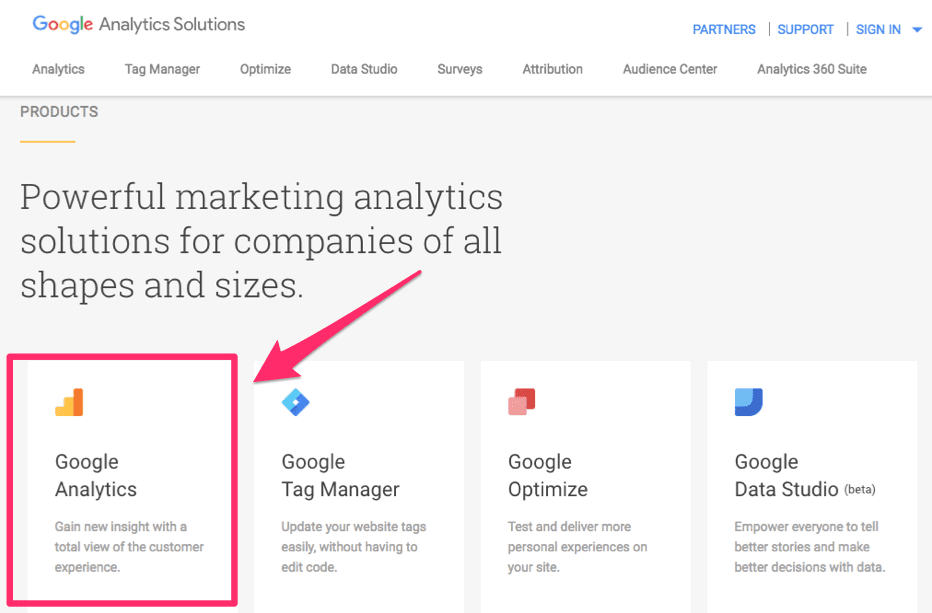
- User Engagement: Tools like Google Analytics can provide insights into user behavior.
- App Store Optimization: Understanding different algorithms is key to improving download rates.
- Performance Metrics: Slow loading times and glitches can negatively impact user experience.
- User engagement
- Consumer satisfaction
- Acquisition
- Performance
 Monitoring engagement will help you focus on the user experience.
This is directly related to consumer satisfaction.
You’ve also got to track acquisition metrics to see how you’re getting downloads and where they’re coming from.
Measuring the performance of your app is also absolutely necessary.
If you’ve got slow loading times, glitches, or crashes, it’s going to impact the user experience as well and ultimately affect your bottom line.
I’ll go into greater detail about each metric below.
Here’s what you need to track.
Monitoring engagement will help you focus on the user experience.
This is directly related to consumer satisfaction.
You’ve also got to track acquisition metrics to see how you’re getting downloads and where they’re coming from.
Measuring the performance of your app is also absolutely necessary.
If you’ve got slow loading times, glitches, or crashes, it’s going to impact the user experience as well and ultimately affect your bottom line.
I’ll go into greater detail about each metric below.
Here’s what you need to track.
1. Number of downloads
Downloads are a strong indication of how your app is doing. This is a metric that measures user engagement. Each time your app is installed on a unique device, it counts towards your download rate. If you’re getting thousands of daily downloads, it means that the consumers are responding well to your brand and marketing strategy. But on the flip side, if you’re not getting many downloads at all, you’ve got to re-evaluate your marketing campaign. You can improve the number of downloads you’re getting by making sure your app is optimized for the app store. Focus on things like your app’s name, description, keywords, and app icon. You’ve got to understand the different algorithms between the Apple App Store and Google Play Store.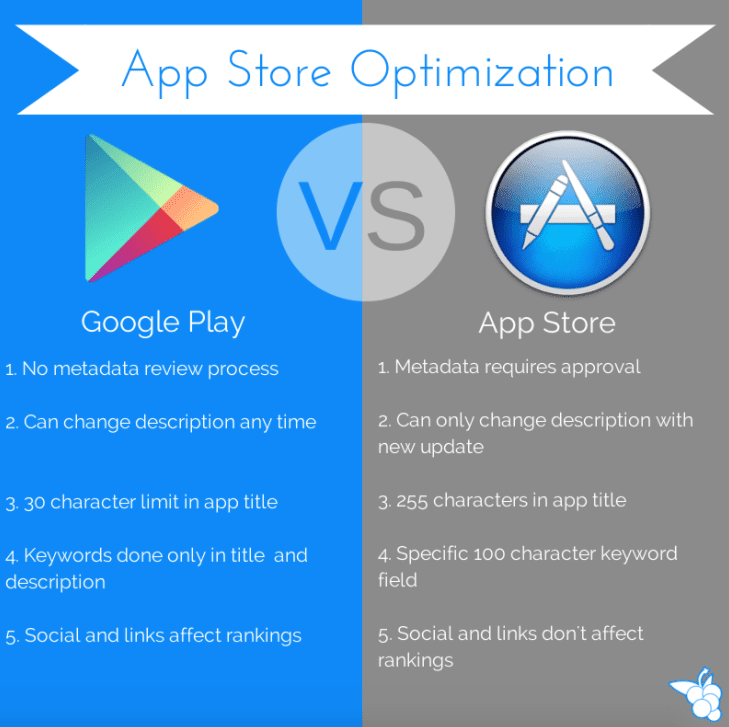
| Platform | Optimization Focus |
|---|---|
| Apple App Store | App name, description, keywords, app icon |
| Google Play Store | App name, description, keywords, app icon |
2. Active users
Active users are not the same as your download rate. This metric also measures engagement. Once someone installs the app on their mobile device, it doesn’t mean that they are actually going to use it. So figure out how many people are active daily and how many users are active each month. There are a few different ways you can improve how frequently people are active on your app. You’ve got to entice them to open it up. So try sending out a push notification to get their attention. If you’re selling something, offer a daily deal or weekly promotion that will encourage people to open up your app. Get monthly active users to become daily active users by targeting them first.3. Session intervals
Session intervals measure the user engagement as well. This shows the time between each user session. It’s not exactly the same as daily or monthly active users. Your session interval metrics will break down your active users even further. Do they open your app every hour? (That would be great). Short intervals are the best. It means that your active users aren’t going a long time between each usage. The best way to improve this number is by making your app part of their daily routine. Think about how often you open up your email or social media apps. That’s the kind of connection you want your users to have. Measuring the session intervals will help you with this.4. Average usage time
The average usage time continues to break down the session intervals. This metric measures how long each session lasts. Does the user open the app for ten seconds and then close it? Or does their session lasts for ten minutes? Interestingly enough, the size of the user’s screen impacts how long each session lasts for.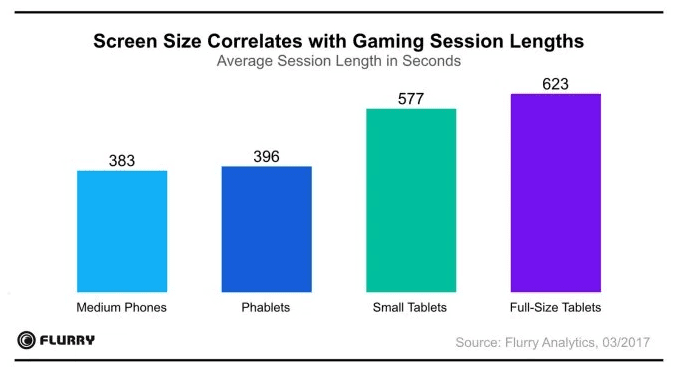 The graphic above shows that bigger screens translate into longer average usage times for people when they are playing games.
This is important for you to recognize when you’re calculating this metric.
You’ll also want to figure out how many screens the user is viewing during each session.
To improve this number, design your app to encourage more clicks to new screens.
Just make sure it doesn’t become too tedious and end up hindering the user experience.
Users are more engaged if they view lots of screens and have a long usage time.
The graphic above shows that bigger screens translate into longer average usage times for people when they are playing games.
This is important for you to recognize when you’re calculating this metric.
You’ll also want to figure out how many screens the user is viewing during each session.
To improve this number, design your app to encourage more clicks to new screens.
Just make sure it doesn’t become too tedious and end up hindering the user experience.
Users are more engaged if they view lots of screens and have a long usage time.
5. Churn Rates
Your churn rate measures the percentage of users who just stop using your app. This is a major problem when your most active users are part of this group. Typically, your most active users are your most profitable users. So a high churn rate can definitely impact your revenue stream and bottom line. Obviously, you don’t want anyone to abruptly stop using your app, but it’s not as big of an issue if your low value users stop. To improve your churn rates, you’ve got to get to the root of the problem for why users stopped using your app. Send them an email, push notification, or SMS message and ask them to take a survey about their experience. Give them an offer to try and welcome them back. Anything that improves user engagement will help keep your churn rates low.6. Your ranking in the Apple App Store and Google Play Store
Your search ranking impacts your download rates, which we discussed earlier. So to improve your search ranking, you’ll want to employ the same strategy we talked about before as well. Know the app store optimization algorithms for each platform that your app is available on. Higher search rankings will translate to more downloads. The majority of apps are downloaded from general browsing in the app store.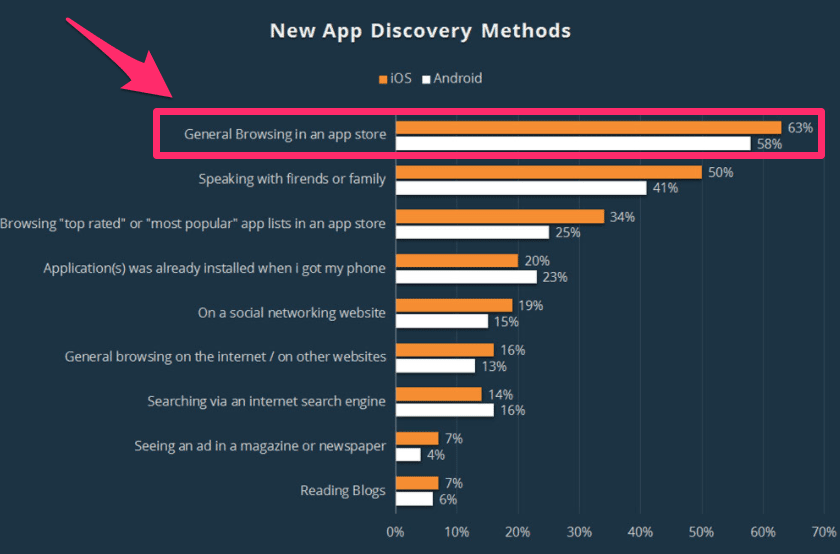 As you can see from the graphic above, this statement holds true for both Android and iOS platforms.
If you have a high search ranking, it
increases your discoverability and the chances that users will find you during their general browsing.
As you can see from the graphic above, this statement holds true for both Android and iOS platforms.
If you have a high search ranking, it
increases your discoverability and the chances that users will find you during their general browsing.
7. Abandonment rates
Abandonment rates are not the same as churn rates, even though this metric measures user engagement too. Your app gets abandoned by a user if they install it to their device, but never actually use it or sign up. The best way to fix this is by analyzing your introduction phase and sign up process. Obviously, the person was interested enough to download the app, but why didn’t they use it? It may have to do with the information you’re asking from them in order to proceed. Generally, you shouldn’t ask the user for too much personal info just to navigate within the app. So go back to the drawing board and fix your sign up process if you’re noticing that your abandonment rates are higher than acceptable.8. Conversion rates
Why aren’t you making any money from your app? Look at your conversion strategy. If you’re trying to generate reven11. Acquisition cost
To calculate your acquisition cost, take the number of marketing dollars you’re spending to acquire new users and divide it by the number of acquisitions.| Scenario | Outcome |
|---|---|
| High Acquisition Cost | Can drain your bank account if not managed carefully. |
| Low Acquisition Cost | Indicates efficient spending on user acquisition. |
| Metric | Description |
|---|---|
| AOV | Average Order Value of all users |
| AOV of Paying Users | Average Order Value of users who generate revenue |
25. Lifetime value
Here’s an equation to help you calculate the lifetime value of a customer, or in this case, an app user.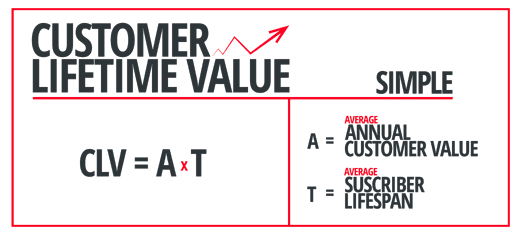 You should also try to estimate how much you expect to make from each user before they stop using the app.
Keep your customer acquisition costs in mind.
How long do they need to use the app in order for you to be profitable?
If the acquisition costs are higher than the lifetime value of a user, you’re going to lose money.
So focus on getting more money from each user and try to extend their lifetime usage.
Making your app part of their daily routine will help minimize their churn, so that you can be profitable.
You should also try to estimate how much you expect to make from each user before they stop using the app.
Keep your customer acquisition costs in mind.
How long do they need to use the app in order for you to be profitable?
If the acquisition costs are higher than the lifetime value of a user, you’re going to lose money.
So focus on getting more money from each user and try to extend their lifetime usage.
Making your app part of their daily routine will help minimize their churn, so that you can be profitable.
Conclusion
Developing your app was expensive. Don’t stop working hard just because it has finally launched. You’ve got to continue spending time, effort, and money. Strive to make improvements if you want to be successful. If you want to measure your success, you’ve got to track certain metrics and take action to improve on those numbers. Track metrics that are related to user engagement, customer satisfaction, acquisition, and performance. Follow the metrics that I’ve outlined in this guide if you need a place to start. These are the 25 most important pieces of information that you need to track, evaluate, and make adjustments for improvements. What steps are you taking to improve the metrics that you’re currently tracking?Frequently Asked Questions
How can I improve my app’s download rate?
Improving your app’s download rate involves optimizing your app store listing with a focus on the app name, description, keywords, and app icon.
What is the difference between active users and downloads?
Downloads refer to the number of times your app is installed, while active users are those who regularly engage with your app.
How do session intervals affect user engagement?
Session intervals measure the time between user sessions. Shorter intervals indicate higher engagement, as users frequently return to the app.
Why is tracking churn rate important for my app?
Tracking churn rate is crucial as it shows the percentage of users who stop using your app. Understanding this metric helps in identifying issues and improving user retention strategies.
How does screen size impact average usage time?
Screen size can influence how long users engage with your app during each session. Larger screens often lead to longer usage times, especially in gaming apps.