Key Uber Statistics
- Uber has a global market value of $72 billion.
- Uber generated $12 billion in gross bookings in the most recent quarter.
- There are more than 75 million active Uber riders across the world.
- Uber is available in more than 80 countries worldwide.
- Uber has completed more than 5 billion rides.
- Over 3 million people drive for Uber.
- In the United States, Uber fulfills 40 million rides per month.
- The average Uber driver earns $364 per month.
Uber United States Market Share
While the idea of Uber was born in Paris back in 2008, the company’s first ride took place in San Francisco. That’s where the Uber headquarters is still located today. With that in mind, I think it makes sense to look at the US market share before we analyze any international data.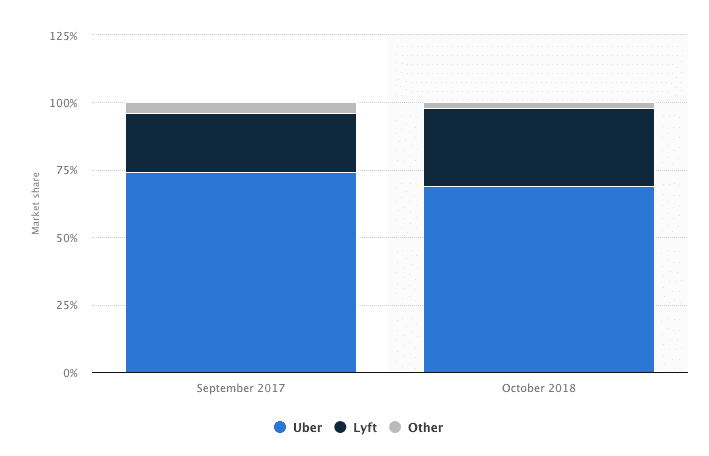 Based on the graphic alone, it’s clear that Uber controls the market share here in the United States. But with that said, they aren’t poised for domination in the coming years.
Let’s look at the last two years. In 2017, Uber had a 74% market share in the US, compared to Lyft at 22%. In 2018, Uber controlled 69% of the market share, while Lyft rose to 29%.
As you can see, Lyft is slowly but surely taking a percentage of the ridesharing industry in the US. However, the lion’s share is still going to Uber.
But based on this trend, it appears that these figures will start to balance out over the course of the next few years. We’ll take a closer look at Uber’s competitors as we continue through this guide.
Based on the graphic alone, it’s clear that Uber controls the market share here in the United States. But with that said, they aren’t poised for domination in the coming years.
Let’s look at the last two years. In 2017, Uber had a 74% market share in the US, compared to Lyft at 22%. In 2018, Uber controlled 69% of the market share, while Lyft rose to 29%.
As you can see, Lyft is slowly but surely taking a percentage of the ridesharing industry in the US. However, the lion’s share is still going to Uber.
But based on this trend, it appears that these figures will start to balance out over the course of the next few years. We’ll take a closer look at Uber’s competitors as we continue through this guide.
Uber Global Penetration
Three years after the concept of Uber was developed in Paris, they launched in that same city with their first international ride in 2011. Over the next few years, Uber would begin launching in other cities across the world.- 2012 — London, United Kingdom
- 2013 — Mexico City, Mexico
- 2013 — Taipei City, Taiwan
- 2013 — Johannesburg, South Africa
- 2013 — Bangalore, India
- 2014 — Beijing, China
- 2014 — Lagos, Nigeria
- 2015 — Nairobi, Kenya
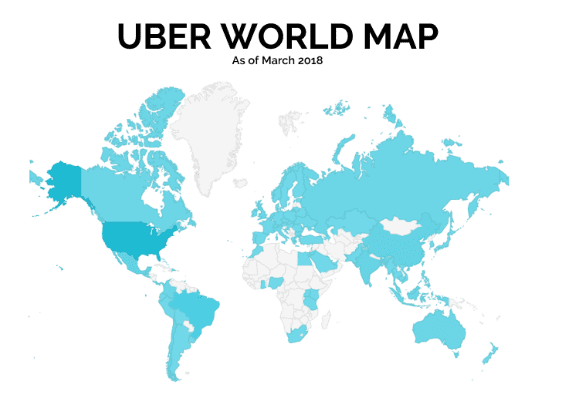 It’s quite remarkable how this company has been able to penetrate markets worldwide over the span of a decade.
This just goes to show you the power of mobile applications. Anywhere users can download a product from an app store is a potential market for your business. Uber clearly recognized this and expanded accordingly.
It’s quite remarkable how this company has been able to penetrate markets worldwide over the span of a decade.
This just goes to show you the power of mobile applications. Anywhere users can download a product from an app store is a potential market for your business. Uber clearly recognized this and expanded accordingly.
Uber Competition
As we’ve briefly mentioned, Uber has competitors. When the concept first came to fruition, taxi cabs were the biggest competition. But today, there are other ridesharing apps, like Lyft, that have a similar business model. We’ll take a closer look at these competitors with real data to see where Uber stacks up.Ridesharing vs. taxi cabs
New York City seems like the taxi capital of the world. Whenever I picture a NYC street, I’m thinking of the roads covered with yellow cabs. But over the last five years, ridesharing usage has been able to penetrate and ultimately surpass the taxi cab market share in New York. Here’s a comparison of taxi rides to ridesharing apps on an annual basis in NYC.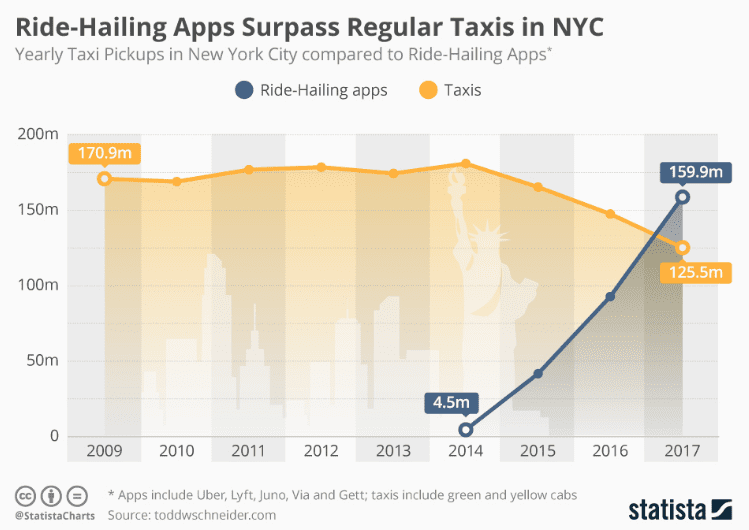 The growth rate of ridesharing in New York City is nothing short of astonishing.
Rideshares grew by more than 3,400% in just four years. While on the flip side, the number of taxi rides decreased by 26% over nine years.
Clearly, the trends are tilting in favor of ridesharing, which is good news for Uber.
The growth rate of ridesharing in New York City is nothing short of astonishing.
Rideshares grew by more than 3,400% in just four years. While on the flip side, the number of taxi rides decreased by 26% over nine years.
Clearly, the trends are tilting in favor of ridesharing, which is good news for Uber.
Uber vs. Lyft vs. Taxi cost
Now let’s take a look at the cost of an Uber ride compared to the competition. Here’s the average cost of a 5.5-mile ride in five major US cities.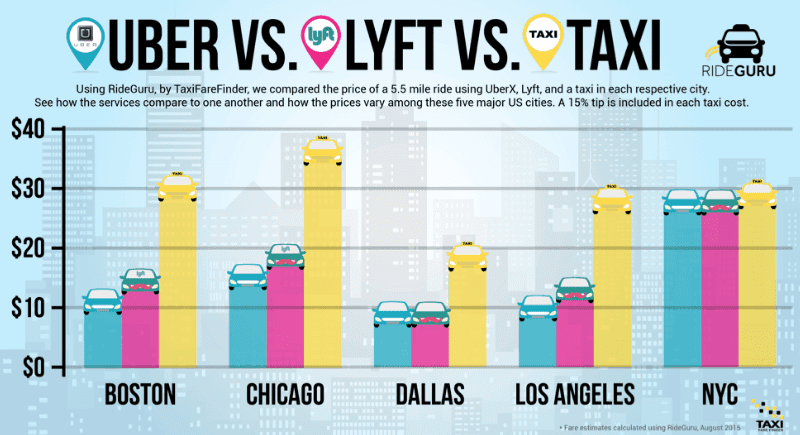 For the most part, Uber is cheaper across the board and significantly less expensive in some cities than others. If you’re going to take a taxi in Boston, the rate is going to be nearly 3x higher than an Uber.
In terms of ridesharing apps, the cost of an Uber ride is slightly less than Lyft, according to the data from this study.
Keep in mind; this information analyzed UberX, which is an economic way to travel. The pricing for other Uber services, such as UberSELECT, UberXL, or UberBLACK will be more expensive.
I know it’s only a matter of opinion, but it’s hard to argue that Uber is not a better service than a traditional taxi. So the fact that this business has been able to offer a product that’s better than the competition, at a lower rate, is one of the reasons why they’ve been so successful.
Nobody wants to pay more money for an inferior service. Even if you look at NYC, where the prices are the same. We previously saw how ridesharing had surpassed taxis in that area. So it’s clear that when consumers are presented with different options at a similar price point, they are still choosing to use ridesharing apps.
For the most part, Uber is cheaper across the board and significantly less expensive in some cities than others. If you’re going to take a taxi in Boston, the rate is going to be nearly 3x higher than an Uber.
In terms of ridesharing apps, the cost of an Uber ride is slightly less than Lyft, according to the data from this study.
Keep in mind; this information analyzed UberX, which is an economic way to travel. The pricing for other Uber services, such as UberSELECT, UberXL, or UberBLACK will be more expensive.
I know it’s only a matter of opinion, but it’s hard to argue that Uber is not a better service than a traditional taxi. So the fact that this business has been able to offer a product that’s better than the competition, at a lower rate, is one of the reasons why they’ve been so successful.
Nobody wants to pay more money for an inferior service. Even if you look at NYC, where the prices are the same. We previously saw how ridesharing had surpassed taxis in that area. So it’s clear that when consumers are presented with different options at a similar price point, they are still choosing to use ridesharing apps.
App installs — Uber vs. Lyft
Based on everything we’ve seen so far, it’s clear that other ridesharing apps pose a bigger threat to Uber than taxis. So let’s see how many people are downloading the Uber app compared to the Lyft app.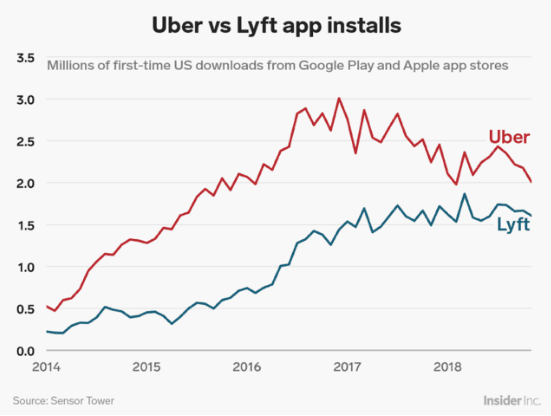 As you can see from this graph, Lyft is right on the heels of Uber in terms of app installs.
Earlier we saw data showing that Uber is slowly starting to lose some of its market share to Lyft, and this data backs up that claim as well.
To me, this says that consumers are more open to other ridesharing options.
In an effort to retain their users, Uber implements customer loyalty programs to keep people from switching to Lyft.
As you can see from this graph, Lyft is right on the heels of Uber in terms of app installs.
Earlier we saw data showing that Uber is slowly starting to lose some of its market share to Lyft, and this data backs up that claim as well.
To me, this says that consumers are more open to other ridesharing options.
In an effort to retain their users, Uber implements customer loyalty programs to keep people from switching to Lyft.
Uber Driver Statistics
Unlike other businesses, Uber needs more than just customers for their business model to work. This platform simply wouldn’t be able to operate without drivers. Drivers use the same app as riders, but have a different profile and dashboard. Compared to other ridesharing services, the majority of drivers primarily drive for Uber exclusively.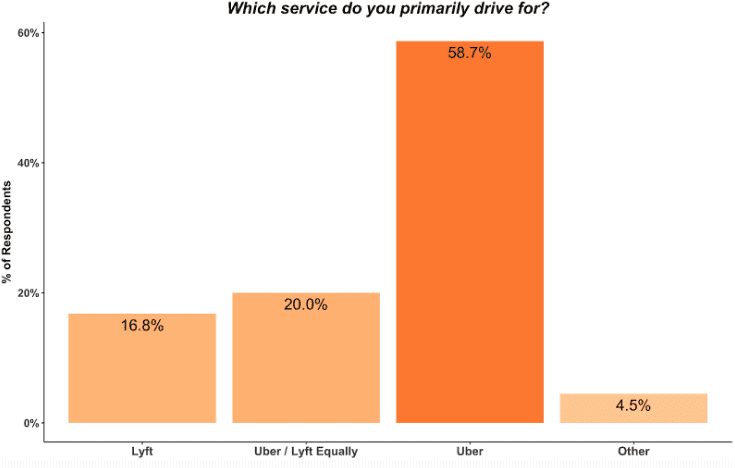 Furthermore, 47.7% of drivers are signed up for two on-demanded services. 17.9%, 6.9%, and 5.9% are signed up for three, four, and more than five services, respectively.
Even though so many of these drivers have signed up for other apps and services, it’s encouraging for Uber that nearly 60% drive them almost exclusively.
Uber wants riders to get connected with a driver almost instantly. If users have to wait a long time for their ride to show up, it won’t be as good of an experience for the customer.
46% of Uber drivers have been on the platform for less than a year. Just 11% of them have been driving Uber for three years or more.
Furthermore, 47.7% of drivers are signed up for two on-demanded services. 17.9%, 6.9%, and 5.9% are signed up for three, four, and more than five services, respectively.
Even though so many of these drivers have signed up for other apps and services, it’s encouraging for Uber that nearly 60% drive them almost exclusively.
Uber wants riders to get connected with a driver almost instantly. If users have to wait a long time for their ride to show up, it won’t be as good of an experience for the customer.
46% of Uber drivers have been on the platform for less than a year. Just 11% of them have been driving Uber for three years or more.
Average monthly earnings per driver
So how much do Uber drivers make? Let’s look and see their average earnings compared to other sharing platforms.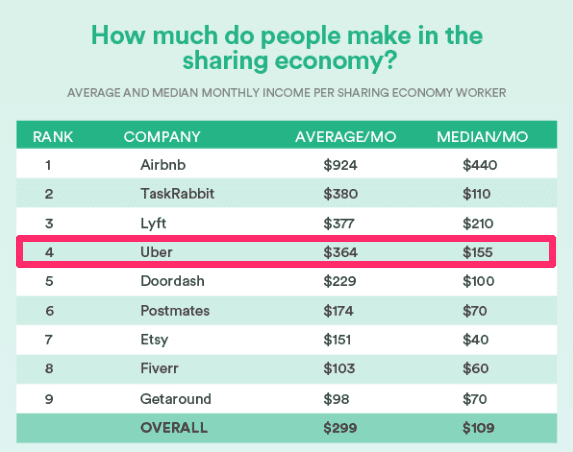 As you can see, the average Uber driver makes $364 per month, which is slightly lower than the average Lyft driver.
Here’s a more in-depth breakdown of those monthly figures.
As you can see, the average Uber driver makes $364 per month, which is slightly lower than the average Lyft driver.
Here’s a more in-depth breakdown of those monthly figures.
- 45% earn $99 or less
- 39% earn $100 – $499
- 11% earn $1,000 – $1,499
- 2% earn $1,500 – $1,999
Average hourly earnings per driver
Now you know how much drivers make per month, but that doesn’t tell us what their time is worth. Here is some additional data on the average hourly earnings for Uber drivers.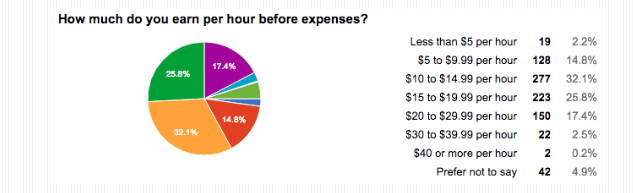 On average, an Uber driver makes $15.68 per hour. That’s not bad, considering the Federal minimum wage in the US is $7.25 per hour.
However, that hourly rate for drivers is before expenses. Remember, Uber drivers are responsible for their own vehicles, so you have to factor in things like:
On average, an Uber driver makes $15.68 per hour. That’s not bad, considering the Federal minimum wage in the US is $7.25 per hour.
However, that hourly rate for drivers is before expenses. Remember, Uber drivers are responsible for their own vehicles, so you have to factor in things like:
- Gas
- Insurance
- Depreciation
- Maintenance
- 18-30: $17.98 per hour
- 31-40: $17.17 per hour
- 41-50: $16.45 per hour
- 51-60: $16.15 per hour
- Over 61: $14.57 per hour
Uber driver demographics
So who exactly is behind the wheel of these cars? Here is the demographic makeup of Uber drivers.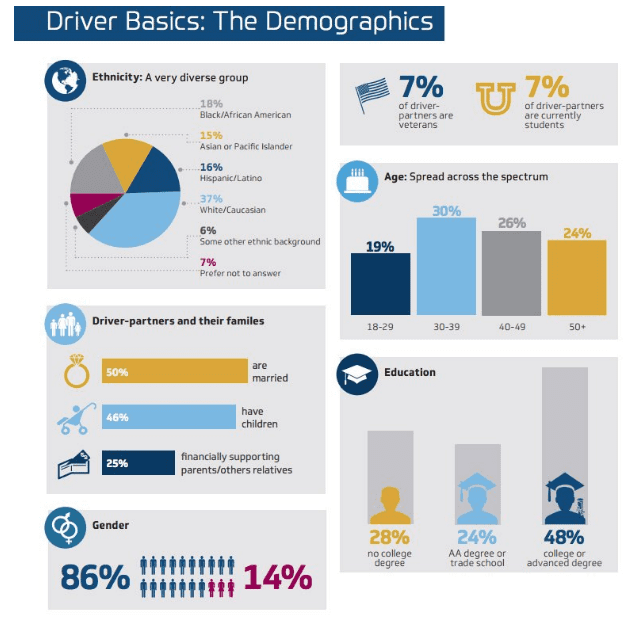 From an ethnicity standpoint, the drivers are very diverse. The percentage of different age groups is diverse as well.
About half of all Uber drivers are married and have children. Nearly half of drivers have a college education or advanced degree.
Gender is the only area where drivers are not diverse. The overwhelming majority of Uber drivers are men.
From an ethnicity standpoint, the drivers are very diverse. The percentage of different age groups is diverse as well.
About half of all Uber drivers are married and have children. Nearly half of drivers have a college education or advanced degree.
Gender is the only area where drivers are not diverse. The overwhelming majority of Uber drivers are men.
Uber Rider Statistics
We’ve established that the business model won’t work without drivers. But Uber still needs customers to turn a profit. We’ll cover some statistics about their riders. These are the same mobile app users who could potentially download your app as well.Global ridesharing users
As a whole, the ridesharing market is growing at a steady rate.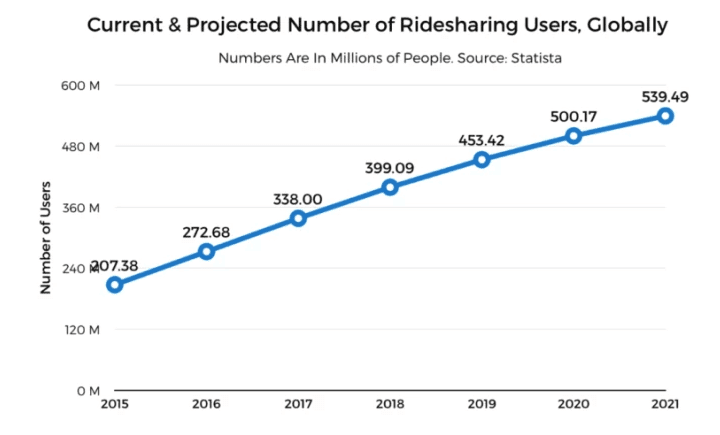 By 2021, it’s projected that nearly 540 million people worldwide will use ridesharing apps.
Today, about 2.5 billion people worldwide have smartphones. So roughly 18% of all smartphone users across the world are using ridesharing apps in 2019.
By 2021, it’s projected that nearly 540 million people worldwide will use ridesharing apps.
Today, about 2.5 billion people worldwide have smartphones. So roughly 18% of all smartphone users across the world are using ridesharing apps in 2019.
US rider demographics
Remember, everyone who uses Uber downloaded the app from the app store. So these users are potential customers for your app as well. In order for your app to be successful, you need to understand who you’re targeting. Let’s take a closer look at the demographics of Uber users in the US.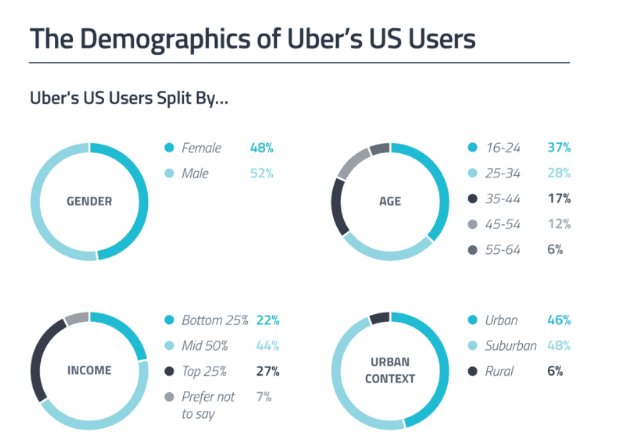 Unlike the drivers, male and female users are nearly an even split for riders.
The majority of Uber users fall in the 16-34 age range. But 35% of riders are over the age of 35.
People in all income brackets use this service. But only a small percentage of Uber users come from rural areas.
Unlike the drivers, male and female users are nearly an even split for riders.
The majority of Uber users fall in the 16-34 age range. But 35% of riders are over the age of 35.
People in all income brackets use this service. But only a small percentage of Uber users come from rural areas.
Uber vs. Lyft riders
Now we’ll see if there is a major difference between Uber riders and Lyft riders.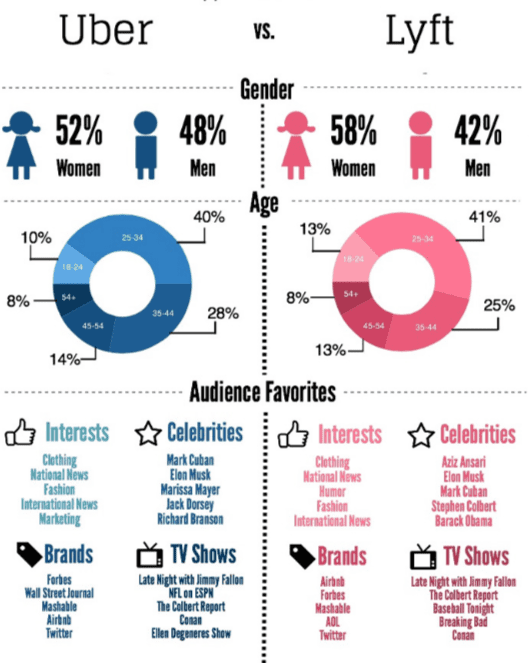 For the most part, the riders on both platforms are very similar.
A higher percentage of women use Lyft compared to Uber, but it’s not an overwhelming difference. In terms of age, interests, favorite brands, and pop culture, there is a lot of overlap and commonality between each platform.
What does this tell you?
Overall, I think the ridesharing market in the US is the same, regardless of which platform they are using. So it will come down to things like customer experience, promotions, price, and marketing to sway customers toward one app over the other.
For the most part, the riders on both platforms are very similar.
A higher percentage of women use Lyft compared to Uber, but it’s not an overwhelming difference. In terms of age, interests, favorite brands, and pop culture, there is a lot of overlap and commonality between each platform.
What does this tell you?
Overall, I think the ridesharing market in the US is the same, regardless of which platform they are using. So it will come down to things like customer experience, promotions, price, and marketing to sway customers toward one app over the other.
Uber Revenue Statistics
At the end of the day, money talks. Uber revolutionized the way people travel, but they are still in business to make a profit. The same goes for your app. Everything you do needs to benefit your bottom line. Let’s see how everything we’ve looked at so far is translating into money for Uber.Uber quarterly revenue
As of last year, Uber’s quarterly revenue is approaching $3 billion.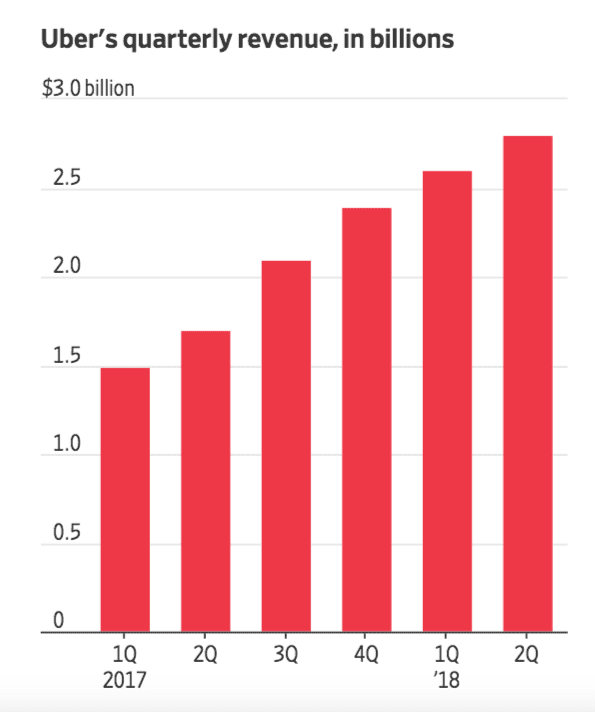 It’s a huge number, to say the least. But what’s more important than the number is the growth pattern.
Here’s the thing. Your app might not make $3 billion per quarter (although it would be nice). But with that said, as long as you’re trending upward and continuing to make more money, it’s a great sign for your business.
It’s a huge number, to say the least. But what’s more important than the number is the growth pattern.
Here’s the thing. Your app might not make $3 billion per quarter (although it would be nice). But with that said, as long as you’re trending upward and continuing to make more money, it’s a great sign for your business.
Uber net loss
With that said, Uber is actually losing money.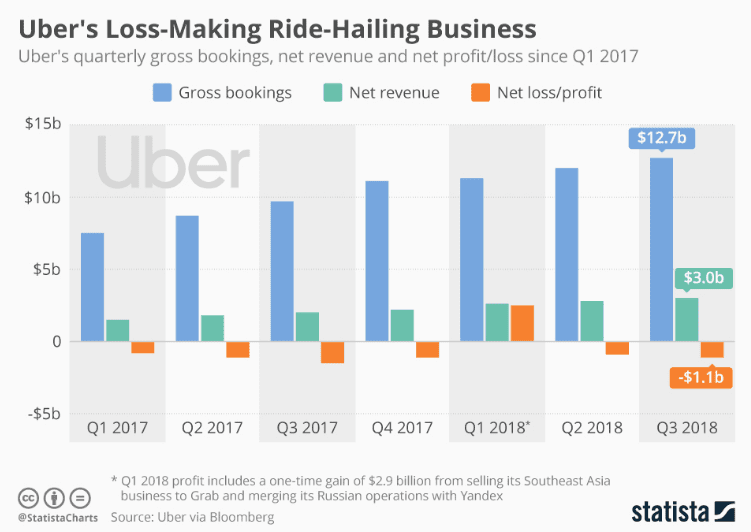 In Q3 of 2018, the Uber platform had $12.7 billion in bookings. Uber’s cut of that share was roughly $3 billion. But they had a net loss of $1.1 billion.
Even though total gross bookings are growing by 34% year-over-year, Uber is still losing money.
How is this possible?
According to Crunchbase, here are Uber’s biggest operational costs.
In Q3 of 2018, the Uber platform had $12.7 billion in bookings. Uber’s cut of that share was roughly $3 billion. But they had a net loss of $1.1 billion.
Even though total gross bookings are growing by 34% year-over-year, Uber is still losing money.
How is this possible?
According to Crunchbase, here are Uber’s biggest operational costs.
- Sales and marketing – $734 million
- General and administrative – $704 million
- Research and development – $362 million
- Operations and support – $344 million
- Other operational costs – $97 million
Average monthly spending per user — Uber vs. Lyft
As I just said, Uber is getting more than $12 billion per quarter in bookings. So where is this money coming from? Here’s a look at how much money ridesharing users spend in the US.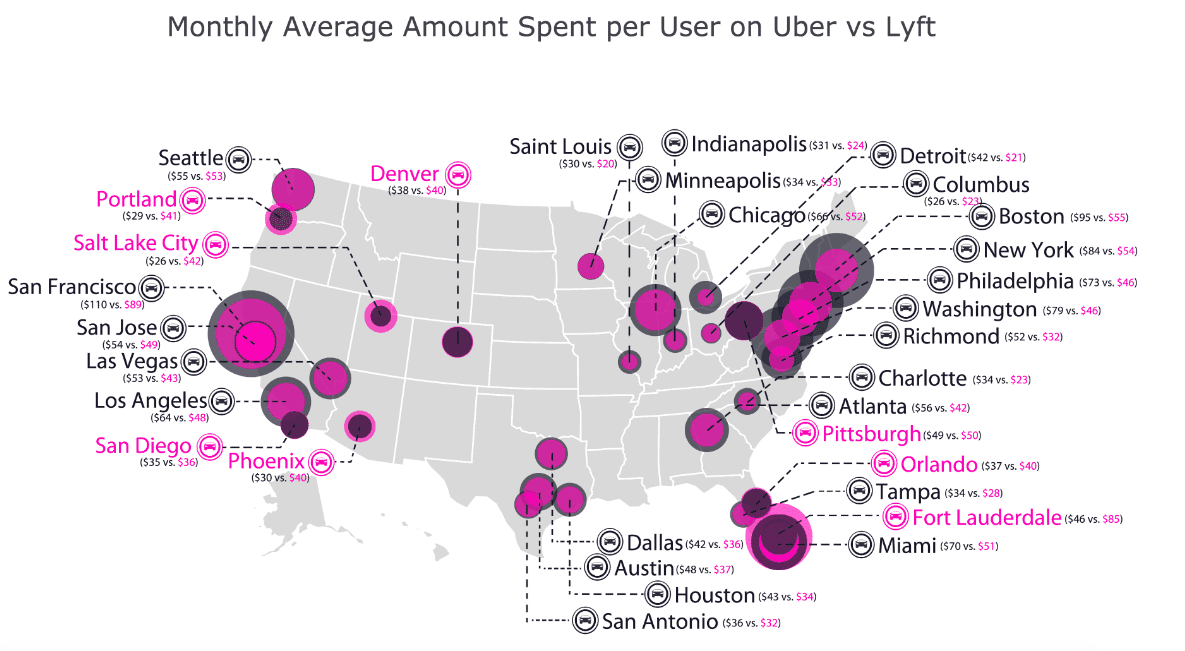 These are some of the cities with the highest monthly spending per user through the Uber app:
- San Francisco, CA – $110
- Boston, MA – $95
- New York, NY – $84
- Washington, DC – $79
- Philadelphia, PA – $73
- Miami, FL – $70
- Chicago, IL – $66
- Los Angeles, CA – $64
- Salt Lake City, UT
- Phoenix, AZ
- Portland, OR
- Orlando, FL
- Denver, CO
- Pittsburgh, PA
- Fort Lauderdale, FL
- San Diego, CA
Uber valuation
Even though Uber is losing billions of dollars annually, the company is still valued at over $70 billion.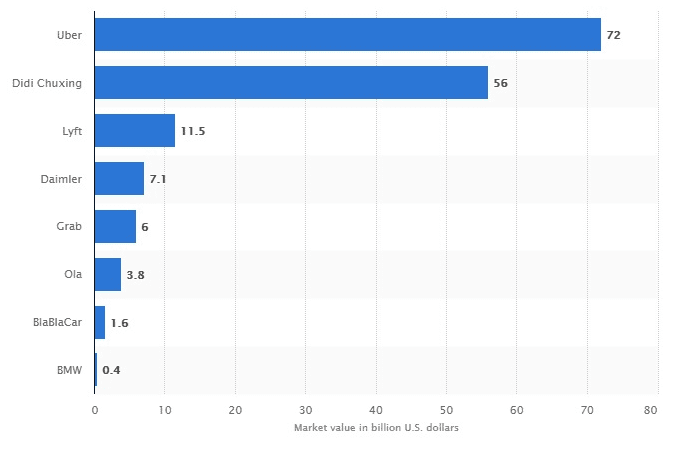 That’s more than six times the value of Lyft.
The Chinese ridesharing company, Didi Chuxing, is the only other company in the same ballpark as Uber in terms of their valuation.
That’s more than six times the value of Lyft.
The Chinese ridesharing company, Didi Chuxing, is the only other company in the same ballpark as Uber in terms of their valuation.
Other Uber Business Ventures
The Uber app itself has different types of rides within the platform, such as Uber X, UberPOOL, and UberBLACK, just to name a few. But Uber has other business ventures, like UberEATS, which is a completely separate app. Here’s a look at where UberEATS stands in terms of the food delivery market share.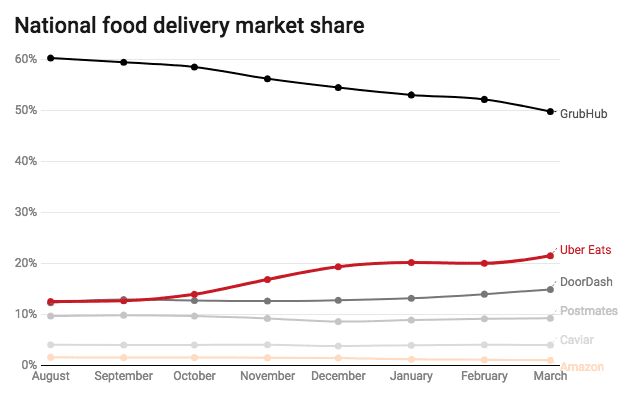 GrubHub dominates this category. UberEATS still has quite a bit of catching up to do. But as you can see from this graph, GrubHub is on the decline, while UberEATS is on the rise.
In some of major US cities, UberEATS controls the market share. This is especially true in Texas.
GrubHub dominates this category. UberEATS still has quite a bit of catching up to do. But as you can see from this graph, GrubHub is on the decline, while UberEATS is on the rise.
In some of major US cities, UberEATS controls the market share. This is especially true in Texas.
- El Paso
- Fort Worth
- Austin
- Dallas
- Houston
- San Antonio
Conclusion
Uber is part of the way we live. In some instances, it’s become a verb, in addition to the name of a business. But at the end of the day, Uber is a mobile app. This app gets downloaded by users the same way they would download any other app. This just goes to show you how much money can be made with mobile apps. You don’t need to revolutionize an industry or become the next Uber to have a successful app. There are still plenty of other ways for you to make money. For those of you who haven’t developed your app just yet, you can learn from apps that came before you, like Uber. What elements of Uber’s business model can you apply to your own mobile app?Frequently Asked Questions
How does Uber generate revenue?
Uber generates revenue by taking a percentage of each transaction between riders and drivers.
What is Uber’s market share in the US?
As of recent statistics, Uber holds a significant market share in the US ridesharing industry, although competitors like Lyft are gradually increasing their share.
How has Uber expanded globally?
Uber has expanded globally by launching in major cities worldwide, recognizing the potential of mobile applications.
What are the main competitors of Uber?
Uber’s main competitors include other ridesharing apps like Lyft, which have similar business models. Taxi cabs were initially the biggest competition.