- Users need to download your app.
- Users need to use your app.
Key Mobile App Statistics for 2024
- Mobile apps are expected to generate over $935 billion in revenue in 2024.
- The Apple App Store has 1.96 million apps available for download.
- There are 2.87 million apps available for download on the Google Play Store.
- 21% of Millennials open an app 50+ times per day.
- 49% of people open an app 11+ times each day.
- 70% of all US digital media time comes from mobile apps.
- The average smartphone owner uses 10 apps per day and 30 apps each month.
Mobile App Downloads
Apps can’t succeed without downloads. It sounds simple, but all too often I app owners overlook this. You could have the best app on the planet, but if nobody is downloading it, you won’t make a dime. So before you can get people to download your app, you need to take the time to conduct the proper research. To get you started, I’ve found the most relevant mobile app download statistics for 2024.Global Downloads
People all over the world are using smartphones and tablets. As mobile app usage grows in popularity, the number of app downloads worldwide increases as well.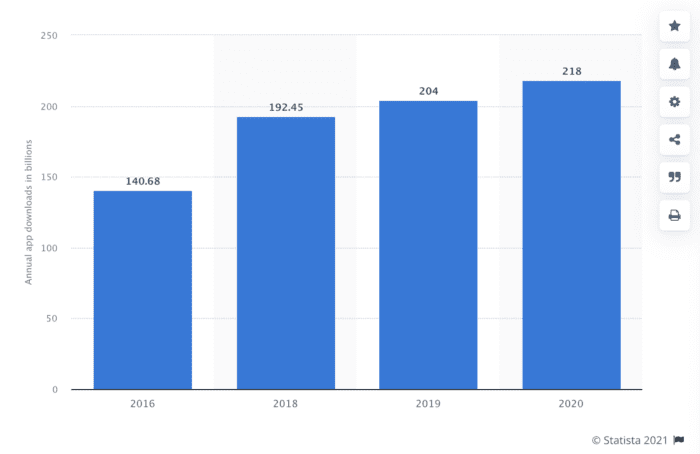 We’re seeing growth in app downloads each year. This trend will continue in the coming years as well.
Last year, there were more than 218 billion app downloads. That’s roughly a 7% increase from the year prior.
As you can see from the graph, there was a 55% jump between 2016 and 2020. The year over year growth rate isn’t quite as sharp, but it’s still on the rise.
We’re seeing growth in app downloads each year. This trend will continue in the coming years as well.
Last year, there were more than 218 billion app downloads. That’s roughly a 7% increase from the year prior.
As you can see from the graph, there was a 55% jump between 2016 and 2020. The year over year growth rate isn’t quite as sharp, but it’s still on the rise.
Free vs. Paid Downloads
When you’re creating a mobile app, one of the first things you need to figure out is your monetization strategy. That’s why you’re building an app in the first place, right? To make money. Charging for app downloads might be something that’s crossed your mind. But will people download your app if you make them pay for it? Let’s take a look at the number of free vs. paid app downloads. The vast majority of global downloads are all free. In fact, 98% of mobile app revenue worldwide comes from free apps. Just a fraction of people are willing to pay for downloads. Don’t get me wrong; I’m not saying that you should completely dismiss the idea of launching a paid app. Depending on the type of app you have, there are benefits to both strategies. If you charge for downloads initially, fewer mobile users will download the app. That’s because the majority of people are used to being offered free downloads. Just look at your own mobile device. Do you have any apps that you paid to install? You’re in the minority if you do. However, people who download paid apps are more likely to be engaged. They aren’t going to spend money on something and then never use it. But you don’t need to charge for downloads to make money with your app. For those of you who own an existing business and have an app as an extension of that business to improve the customer experience should definitely be offering free downloads. Mobile app users don’t expect to pay for downloads. That’s because the vast majority of apps available on the Apple App Store and Google Play Store are offered for free.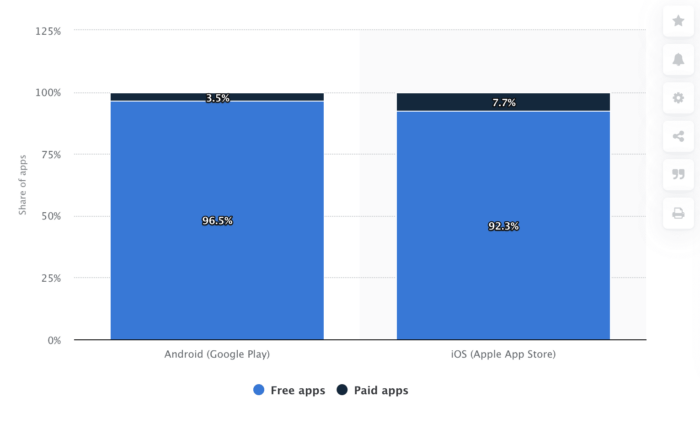 The above graph is based on a research from Statista as of Deptember 2021.
Even if you’re launching an app as a completely new business, you can still make money by offering your app for free. There are plenty of other monetization strategies, such as offering in-app purchases.
If you’re using your app to sell products or services, review the latest mobile ecommerce revenue and usage statistics.
The above graph is based on a research from Statista as of Deptember 2021.
Even if you’re launching an app as a completely new business, you can still make money by offering your app for free. There are plenty of other monetization strategies, such as offering in-app purchases.
If you’re using your app to sell products or services, review the latest mobile ecommerce revenue and usage statistics.
Google Play vs. App Store Downloads
There are two places where the overwhelming majority of mobile users are downloading apps. Users with iOS devices download iPhone apps from the Apple App Store, while Android app users download from the Google Play Store. Look at how these two platforms compare to each other in terms of global app downloads.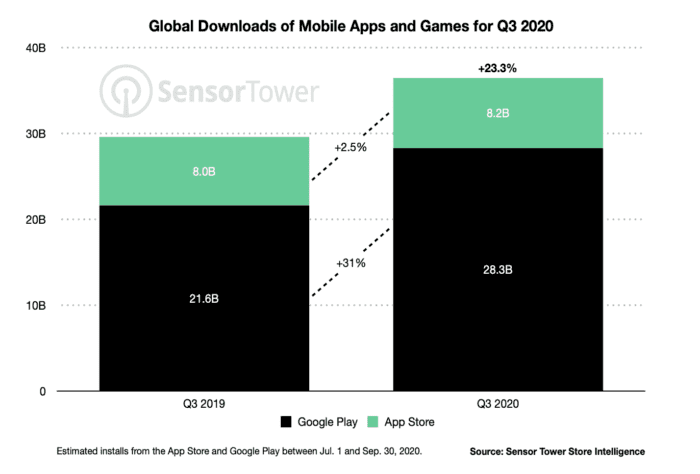 Worldwide, there are more downloads coming from the Google Play Store. But as you can see, both stores saw an increase in the percentage of downloads from 2019 to 2020.
The Google Play Store downloads grew by 31%, while the Apple App Store had just a 2.5% growth rate.
In short, the Google Play Store has more downloads and is growing at a higher rate.
I expect to see these trends continue in 2024.
Note: Not sure which platform to build for first? With BuildFire, you don’t have to make that decision. The BuildFire app development process allows you to create iOS apps and Android apps, simultaneously. So you can launch on both stores and drive downloads from as many users as possible.
Worldwide, there are more downloads coming from the Google Play Store. But as you can see, both stores saw an increase in the percentage of downloads from 2019 to 2020.
The Google Play Store downloads grew by 31%, while the Apple App Store had just a 2.5% growth rate.
In short, the Google Play Store has more downloads and is growing at a higher rate.
I expect to see these trends continue in 2024.
Note: Not sure which platform to build for first? With BuildFire, you don’t have to make that decision. The BuildFire app development process allows you to create iOS apps and Android apps, simultaneously. So you can launch on both stores and drive downloads from as many users as possible.
Apple App Store Download Statistics
We’ve already looked at how the two app stores compared to one another. But now it’s time to break these numbers down even further and take a closer look at each platform. Let’s start with the Apple App Store download statistics.Most Popular App Store Categories
In order for your app to be successful, you need to understand what consumers want. This is especially true if you’re building a new app. Your app might be revolutionary in terms of the software or concept, but if there’s no market for its usage, then you’re going to struggle to get downloads. First, you should understand what types of apps are being downloaded the most. Here are the most popular categories on the Apple App Store by share of availability.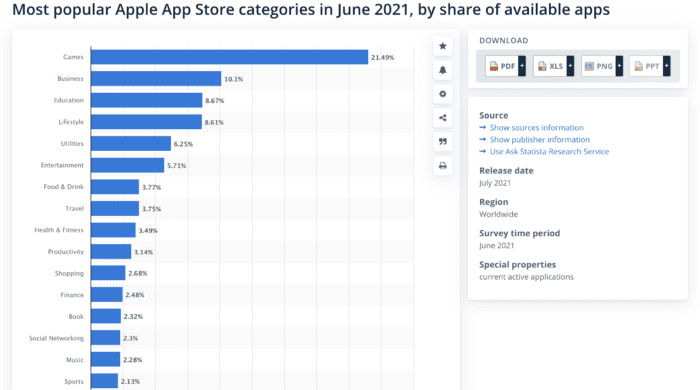 The gaming category dominates the App Store.
But unless you’re planning to build a new app from scratch, you’re probably not going to have a game. For example, let’s say you have an ecommerce store. It doesn’t make sense to launch a gaming app for your business just so your app can fall into a more popular category.
Your app category needs to be relevant to the purpose and functions of your app. So if you own a business or lifestyle app, you can’t just categorize it as a game to try and get more downloads.
In fact, it’s against the App Store review guidelines if you don’t pick a category for your app’s primary purpose.
Violating these terms can get your app removed from the App Store. Obviously, nobody will be able to download your app if this happens.
So don’t try to trick the system. Your app can still be successful even if it’s not in a top category. Those categories have more competition. Depending on your strategy, you could potentially target a niche category that’s less saturated and try to dominate a larger share of a smaller market.
The gaming category dominates the App Store.
But unless you’re planning to build a new app from scratch, you’re probably not going to have a game. For example, let’s say you have an ecommerce store. It doesn’t make sense to launch a gaming app for your business just so your app can fall into a more popular category.
Your app category needs to be relevant to the purpose and functions of your app. So if you own a business or lifestyle app, you can’t just categorize it as a game to try and get more downloads.
In fact, it’s against the App Store review guidelines if you don’t pick a category for your app’s primary purpose.
Violating these terms can get your app removed from the App Store. Obviously, nobody will be able to download your app if this happens.
So don’t try to trick the system. Your app can still be successful even if it’s not in a top category. Those categories have more competition. Depending on your strategy, you could potentially target a niche category that’s less saturated and try to dominate a larger share of a smaller market.
Apple App Store Availability
As I just said, the mobile app industry is highly competitive. But how many apps are going to be competing with? Take a look at the number of apps available on the Apple App Store.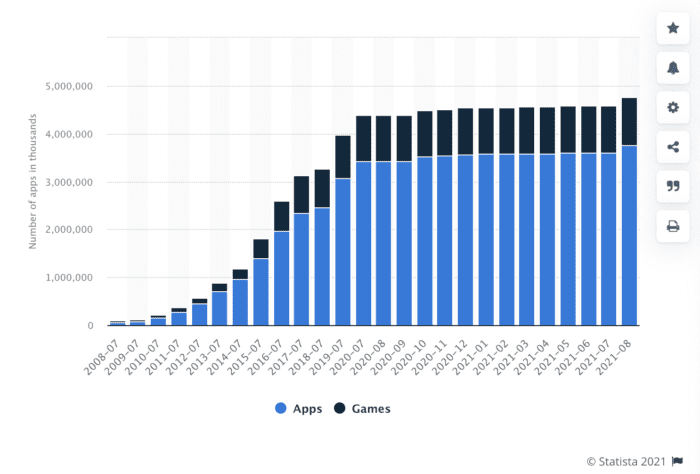 The number of available apps is continuing to rise each year.
Based on all of the statistics we’ve analyzed so far, this makes sense. More people have mobile devices than ever before, and app downloads are at an all-time high. So it’s only natural that more apps are being sent to market.
But are app download numbers on the rise because more apps are available? Or are more apps available because so many more apps have been released?
It’s tough to say, and you can argue both sides. We’ll have a better understanding of this reasoning after we analyze the Google Play Store.
The number of available apps is continuing to rise each year.
Based on all of the statistics we’ve analyzed so far, this makes sense. More people have mobile devices than ever before, and app downloads are at an all-time high. So it’s only natural that more apps are being sent to market.
But are app download numbers on the rise because more apps are available? Or are more apps available because so many more apps have been released?
It’s tough to say, and you can argue both sides. We’ll have a better understanding of this reasoning after we analyze the Google Play Store.
Google Play Store Download Statistics
Now it’s time to look at the download statistics from Android devices. I took the time to create a more in-depth analysis of the Google Play Store.Google Play Store Availability
We just finished looking at the Apple App Store availability. So I wanted to jump right in and show you the number of apps available for download on the Google Play Store.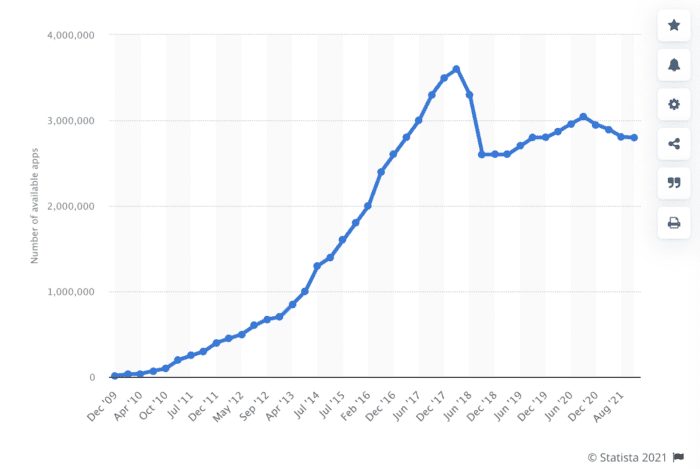 As you can see, the graph doesn’t have the same trajectory as the Apple graph for this same category. We actually saw a drop in app availability after mid 2017. Although the number of apps have been steadily rising ever since.
Why is this happening?
The Google Play Store is highly competitive. Some apps just weren’t able to survive.
I don’t expect to see another downward trajectory. Based on the data over the past two years, the trend line should continuing rising for the foreseeable future.
As we already saw, Google Play Store downloads are still rising, even though the number of apps available for download had dropped a bit during that same period.
Let’s tie this back into our Apple discussion. The Apple App Store app availability numbers are rising each year, but the download growth rate is a lower percentage compared to the Google Play Store. Based on this information, I think it’s safe to conclude that the number of apps available on each store isn’t linked to rising app downloads overall.
As you can see, the graph doesn’t have the same trajectory as the Apple graph for this same category. We actually saw a drop in app availability after mid 2017. Although the number of apps have been steadily rising ever since.
Why is this happening?
The Google Play Store is highly competitive. Some apps just weren’t able to survive.
I don’t expect to see another downward trajectory. Based on the data over the past two years, the trend line should continuing rising for the foreseeable future.
As we already saw, Google Play Store downloads are still rising, even though the number of apps available for download had dropped a bit during that same period.
Let’s tie this back into our Apple discussion. The Apple App Store app availability numbers are rising each year, but the download growth rate is a lower percentage compared to the Google Play Store. Based on this information, I think it’s safe to conclude that the number of apps available on each store isn’t linked to rising app downloads overall.
Most Popular Google Play Store App Categories
You can measure the success of an app category based on penetration. According to Statista, these are the app categories with the highest penetration rate among Android users.- Tools — 99.81%
- Communication — 99.93%
- Business Apps — 99.33%
- Video Players & Edit— 96.63%
- Travel & Local — 95.7%
- Social Media Apps — 95.02%
- Productivity — 91.67%
- Music & Audio — 88.38%
- Entertainment — 83.85%
- News & Magazines — 81.11%
- Photography — 75.77%
- Books & Reference — 70.74%
- Lifestyle — 65.67%
- Personalization — 61.62%
- Games (Casual) — 58.86%
- Games (Puzzle) — 56.5%
- Games (Arcade) — 55.08%
- Shopping — 35.79%
- Games (Action) — 34.19%
- Weather — 32.46%
Mobile App Usage
Now that you’ve seen how users across the world download apps, it’s time to analyze how people are using mobile apps. The average smartphone user spends 3 hours and 10 minutes each day using their device. About 2 hours and 51 minutes of this time is spent on apps (apps account for roughly 90% of smartphone usage). Research shows that there are 80+ apps installed on the average smartphone. But with that said, people aren’t using all of those apps.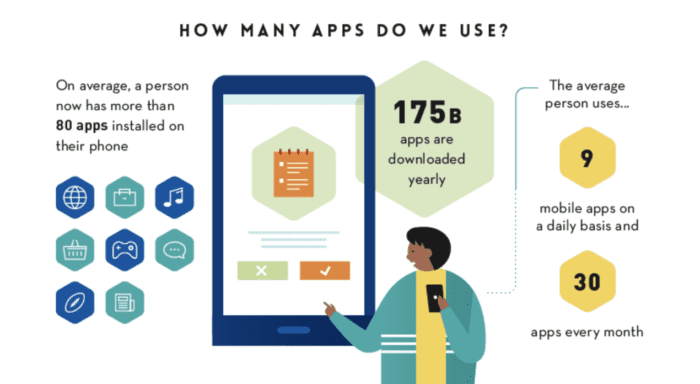 The average person uses 9 mobile apps per day and 30 apps per month.
If the average smartphone user has 80 apps on their phone, this means that more than 62% of those apps don’t get used every month.
What does this mean? It’s simple. People are downloading apps and not using them. In fact, 25% of apps are used only once after being downloaded, and then never used again.
We’ll dive deeper into app usage statistics as we continue through this guide.
The average person uses 9 mobile apps per day and 30 apps per month.
If the average smartphone user has 80 apps on their phone, this means that more than 62% of those apps don’t get used every month.
What does this mean? It’s simple. People are downloading apps and not using them. In fact, 25% of apps are used only once after being downloaded, and then never used again.
We’ll dive deeper into app usage statistics as we continue through this guide.
Mobile App Retention and Churn
As you just learned, app usage is not guaranteed after a download. Some of you might be aware of this if your app has already been brought to market. You may have had an initial surge in terms of the number of downloads, but you’re struggling to make money because people just aren’t using the app. It’s a common problem that I see when I’m consulting with app owners. But how do you know if this is happening to you? The best way to measure this is with retention and churn.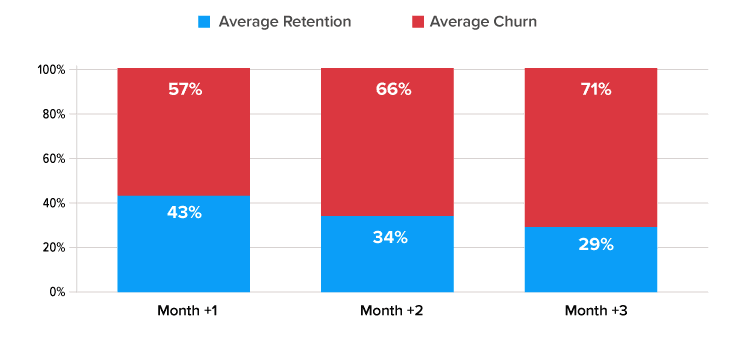 71% of app users churn within the first 90 days of downloading an app.
What does this mean for you and your app?
Basically, you need to track these metrics. Give users a reason to keep coming back and using your app down the road.
You’ll never have 100% retention, so you always need to be coming up with ways to get new downloads. But with that said, it doesn’t mean you should be ignoring existing users.
If your app doesn’t perform well and has glitches, bugs, or UX flaws, people will be more likely to churn. No app is perfect. Even the top apps have bugs now and then. But it’s your responsibility to identify those errors. Come up with updates and new versions of your app to improve the performance and user experience.
71% of app users churn within the first 90 days of downloading an app.
What does this mean for you and your app?
Basically, you need to track these metrics. Give users a reason to keep coming back and using your app down the road.
You’ll never have 100% retention, so you always need to be coming up with ways to get new downloads. But with that said, it doesn’t mean you should be ignoring existing users.
If your app doesn’t perform well and has glitches, bugs, or UX flaws, people will be more likely to churn. No app is perfect. Even the top apps have bugs now and then. But it’s your responsibility to identify those errors. Come up with updates and new versions of your app to improve the performance and user experience.
Most Essential Mobile Apps
Earlier we talked about app popularity in terms of what’s available for download, as well as penetration by category. But just because they are available, it doesn’t mean they are being used. In fact, just because they are being downloaded, it doesn’t mean that they are being used either. We already saw the data to back that claim. Now I want to show you the apps that smartphone users say they can’t live without.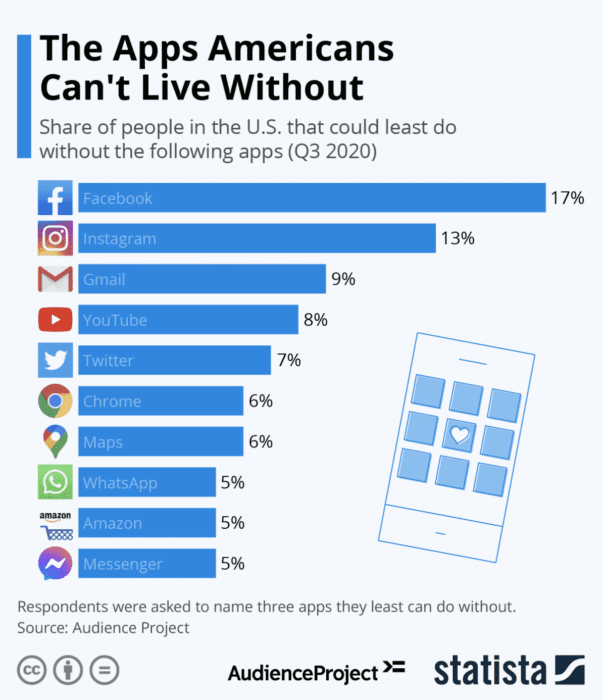 If you look at this list, it makes sense. All of the top apps are used for different purposes and could be used on a daily basis.
- Facebook and Instagram for social media
- Gmail for email communication
- YouTube for video content
- Maps for navigation
- Amazon for online purchases
- WhatsApp and Messenger for instant communication
- Chrome for browsing the Internet
Apple and Android Global Spending
As we’ve seen, there are clearly some download and usage differences between iOS and Android app development. Why? Well, the users aren’t the same. If you compare Apple and Android users, you’ll learn that they behave differently. For starters, let’s look at the way consumers spend money using their devices. Here’s the latest data from Q3 2021:- Google Play Store Gross App Revenue: $12.1 billion
- Apple App Store Gross App Revenue: $21.5 billion
Mobile App Usage by Age
Technology usage varies by generation. Mobile app usage is no exception.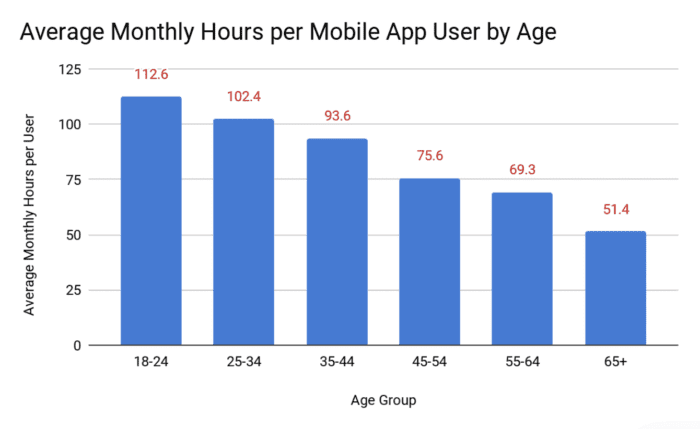 You probably assumed that younger generations spend more time using mobile apps than people who are older. If so, that assumption was correct.
However, that doesn’t mean you can’t target other age groups. As you can see from the graph, people between the ages of 45-54 spend about 1 hour and 15 minutes per day using mobile apps. That’s just 27 minutes less than people in the 25-34 age range.
Even mobile users over the age of 65 spend close to an hour mobile apps every day.
You probably assumed that younger generations spend more time using mobile apps than people who are older. If so, that assumption was correct.
However, that doesn’t mean you can’t target other age groups. As you can see from the graph, people between the ages of 45-54 spend about 1 hour and 15 minutes per day using mobile apps. That’s just 27 minutes less than people in the 25-34 age range.
Even mobile users over the age of 65 spend close to an hour mobile apps every day.
Mobile App Usage by Device
Not all mobile usage is created equally. In addition to the differences between operating systems, the usage will also vary by the type of mobile device that people use.Smartphone App Usage
Digital content can be consumed from so many devices. People have smartphones, tablets, desktop computers, and laptops. You can even access content and apps from smart TVs, watches, smart home devices, and smart vehicles. But there are certain categories that are dominated with smartphone app usage. These are the top categories that people turn to their smartphones for.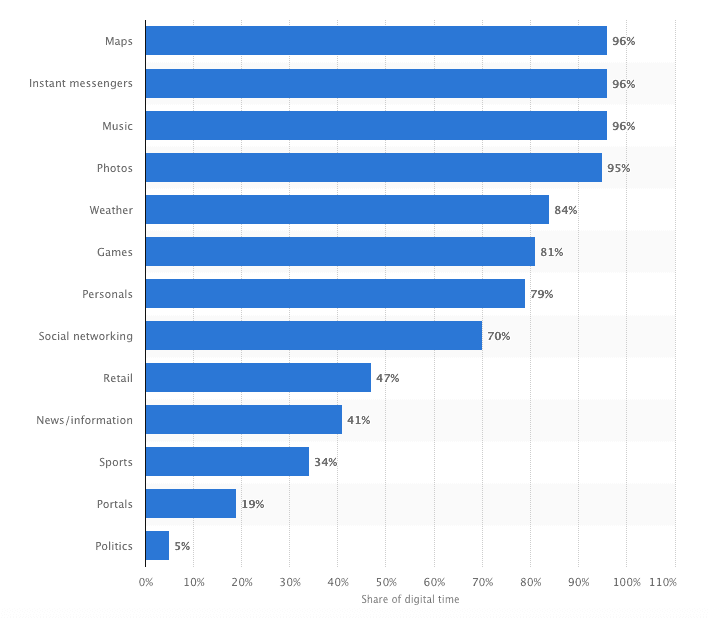 In the United States, 96% of digital time using maps came from smartphones. 86% of digital weather content was consumed through smartphone apps.
Logically, it makes sense. People need to access maps and GPS services on the go, so a smartphone is obviously the best choice.
But if you look farther down this list, you’ll see other categories that aren’t as obvious.
For example, 47% of retail consumption comes from smartphone apps. People have so many ways to buy online, yet they still choose to use smartphones at a high rate.
News and information is another category that jumps out at me. While the smartphone usage is just over 40%, it’s still high considering all of the other platforms and outlets at our disposal.
In the United States, 96% of digital time using maps came from smartphones. 86% of digital weather content was consumed through smartphone apps.
Logically, it makes sense. People need to access maps and GPS services on the go, so a smartphone is obviously the best choice.
But if you look farther down this list, you’ll see other categories that aren’t as obvious.
For example, 47% of retail consumption comes from smartphone apps. People have so many ways to buy online, yet they still choose to use smartphones at a high rate.
News and information is another category that jumps out at me. While the smartphone usage is just over 40%, it’s still high considering all of the other platforms and outlets at our disposal.
Smartphones vs. tablets
Smartphones and tablets have some differences as well. If you recall from earlier, there are twice the number of smartphones worldwide than tablets (2.7 billion vs. 1.35 billion). But tablet usage is starting to catch up with smartphones.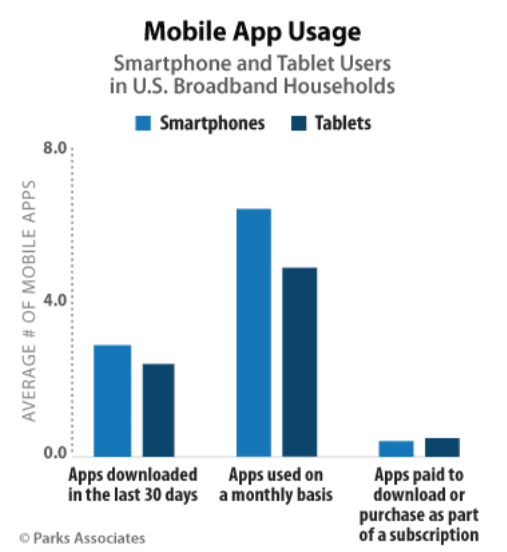 People download more apps on their smartphones and use more smartphone apps on a monthly basis. But as you can see from the visual, tablets aren’t too far behind.
Considering the fact that smartphones are seemingly always within an arm’s reach, it makes sense that they would be used more.
However, tablets outperform smartphones by a hair when it comes to paid apps or subscription purchases via an app. This could be a category that tablets will continue to control in years to come.
People download more apps on their smartphones and use more smartphone apps on a monthly basis. But as you can see from the visual, tablets aren’t too far behind.
Considering the fact that smartphones are seemingly always within an arm’s reach, it makes sense that they would be used more.
However, tablets outperform smartphones by a hair when it comes to paid apps or subscription purchases via an app. This could be a category that tablets will continue to control in years to come.
Tablet Usage
While tablets may not be as popular as smartphones, they are used for specific purposes. Here’s a look at the most popular app categories used on tablets.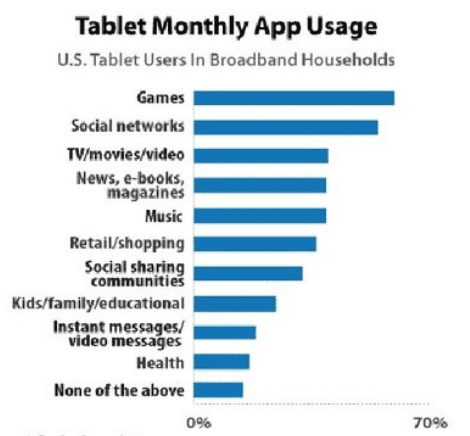 Here’s another instance where gaming ranks first on a usage list. If you compare this graph to the previous one, you could conclude that a user is more likely to pay for gaming apps that are installed on a tablet.
Since tablet screens are larger, the gameplay and user experience will be enhanced. That’s probably why tablet users are willing to pay more for downloads and subscriptions.
Here’s another instance where gaming ranks first on a usage list. If you compare this graph to the previous one, you could conclude that a user is more likely to pay for gaming apps that are installed on a tablet.
Since tablet screens are larger, the gameplay and user experience will be enhanced. That’s probably why tablet users are willing to pay more for downloads and subscriptions.
Mobile App Usage by Country
Like nearly everything else, behavior changes by location. This same concept can be applied to app usage. We’ll take a look and analyze how people in different parts of the world use mobile apps. You can use this information to learn about the audience you’re targeting, or potentially see an opportunity in new markets.App Downloads by Country
Here’s a look at the top app store downloads by leading countries worldwide.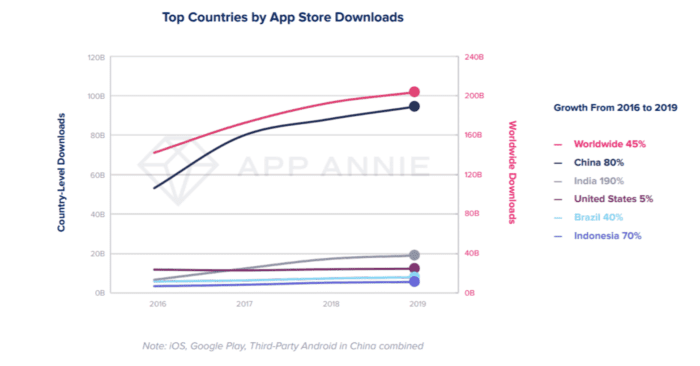 Over the past four years, the number of app downloads in China has grown by 80%.
But other emerging markets like India, Indonesia, and Brazil are all seeing high growth rates as well. As you can see from the graph, India’s app download growth rate over the same stretch is a whopping 190%. This compares to just 5% in the United States.
As technology advances and becomes increasingly accessible in emerging markets across the globe, the potential for targeting international consumers with an app can be appealing for certain businesses.
Over the past four years, the number of app downloads in China has grown by 80%.
But other emerging markets like India, Indonesia, and Brazil are all seeing high growth rates as well. As you can see from the graph, India’s app download growth rate over the same stretch is a whopping 190%. This compares to just 5% in the United States.
As technology advances and becomes increasingly accessible in emerging markets across the globe, the potential for targeting international consumers with an app can be appealing for certain businesses.
Monthly App Usage (in hours)
Now let’s see how much time people are spending using mobile apps in select markets worldwide.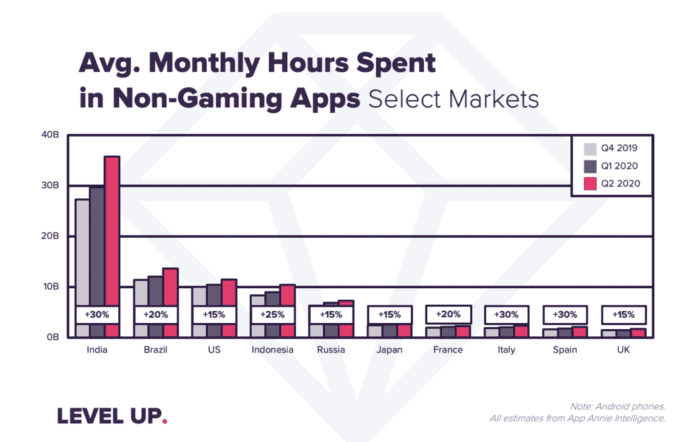 In many ways, this graph mirrors what we saw previously. As downloads rise in India, it makes sense that users would spend more time using apps.
There is one thing that remains consistent across the board for each of these countries. The time spent on mobile apps is growing each year. Take a country like Italy, with a fraction of the population compared India. But both of these markets have seen a 30% growth rate in the average amount time spent using apps from 2019-2020.
In many ways, this graph mirrors what we saw previously. As downloads rise in India, it makes sense that users would spend more time using apps.
There is one thing that remains consistent across the board for each of these countries. The time spent on mobile apps is growing each year. Take a country like Italy, with a fraction of the population compared India. But both of these markets have seen a 30% growth rate in the average amount time spent using apps from 2019-2020.
Apple vs. Google Play (iOS vs. Android) Downloads Worldwide
Android dominates the global market share. So it’s no surprise to see the vast majority of app downloads worldwide come from the Google Play Store.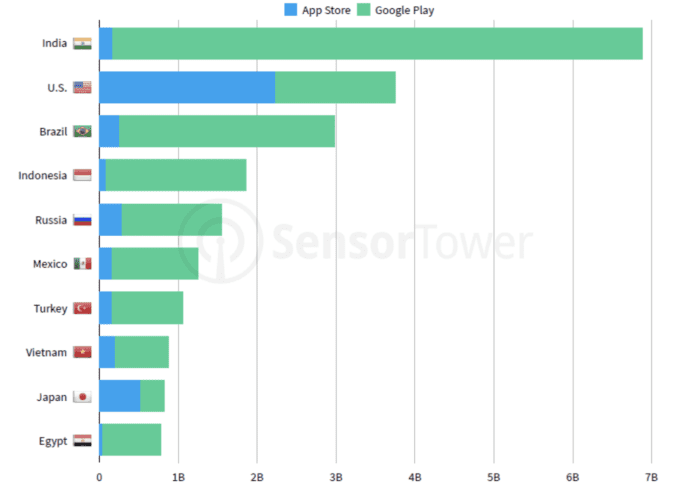 As you can see from the graph, we have closer to a 50/50 split here in the US. Apple App Store downloads have a controlling share in Japan, but the Google Play Store dominates everywhere else.
Final Thoughts
Mobile apps are part of our daily lives. 2024 will continue to a big year for the mobile app industry. Even though mobile usage and penetration are at an all-time high, every piece of data that we analyzed shows we are still trending upward. This is encouraging for anyone who has a mobile app or plans to build one. But you can’t just develop and manage an app without staying up to date on the latest research and trends. So use this guide as a reference to help you understand the mobile app industry from a download and usage perspective. If you’re ready to develop an app in 2024, sign up and get started with BuildFire. Our easy-to-use platform allows you to create an iOS and Android app simultaneously, without writing a single line of code. What metrics are you tracking to measure the usage statistics for your mobile app?Frequently Asked Questions
How many people use smartphones worldwide?
There are over 6.3 billion smartphone users globally, plus another 1.14 billion tablet users — a figure that has grown roughly 36% over the past six years.
How often do people check their phones?
The average American checks their phone 262 times per day. That works out to roughly once every 5.5 minutes.
How much mobile time is spent in apps rather than browsers?
88% of mobile time is spent in apps rather than on the mobile web, which is why an app reaches people in ways a mobile site cannot.
Is the mobile app market still growing?
Yes. App usage and smartphone penetration are still growing at a steady rate, with no signs of slowing in the foreseeable future.