Trying to make a marketing strategy work without using marketing metrics to track results is kinda like setting out on the longest road trip of your life, only without a map.
Sure, you might know where you started, and you might know where you’re going, and you might know what general direction (north, south, east, west) you should head in too.
But because you don’t have a map, you don’t know which highway is fastest, which roads lead to nowhere, and which motels you should stop at for the night. As a result, even if you do end up at your destination (which is highly unlikely), it would have taken you a long time (with a capital L).
In this post, we’ll explore the nitty-gritties of marketing metrics: what statistics you should be tracking, how you can use the results to focus your marketing strategy, and what tools you should be using.
The Marketing Metrics that Count
With the marketing metrics tracking tools available today, you can track just about anything and everything. As a result, it’s easy to end up wasting your time tracking the marketing metrics that don’t give you concrete, actionable information you can actually implement to improve your marketing.
In this section, we’ll take a look at the 5 major categories of analytics (see below), and we’ll investigate each one in depth. We’ll talk briefly about why it’s important to measure to see which metrics will be most useful to you.
- Traffic
- Conversions
- Customer Activity
- Bottom Line
Traffic
The most popular statistics that webmasters track by far are the ones that have to do with traffic.
The Problem with Big-Picture Traffic Statistics
This makes sense, because traffic is a category of analytics that we can easily translate into money for our business. After all, it’s a simple equation:
More traffic = More people viewing my site = More people buying my products = More money
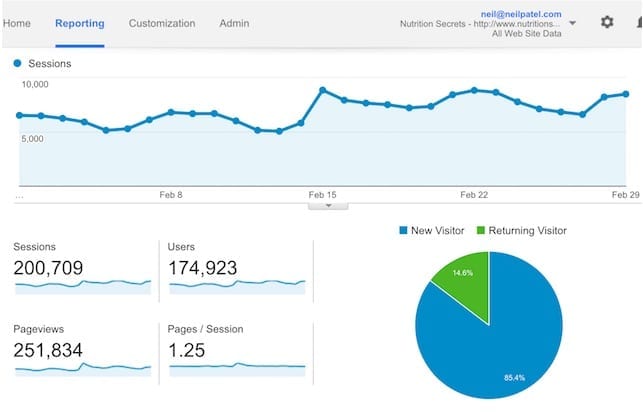
Image via QuickSprout
Because of this seemingly simple & valid equation, people tend to focus on the big-picture traffic statistics, i.e. the number of visitors per day/month/year.
But even though the equation is valid to a certain extent (your online business isn’t going anywhere if you have zero traffic), it is by no means the end-all and be-all of marketing.
The importance of big-picture traffic statistics (e.g. number of visitors per month) is overestimated, for several reasons.
Firstly, these big-picture statistics do not indicate how well that traffic is translating into money. You might be getting 100,000 visitors per month, but if you’re only making $1000, then you’re only making a cent for each visitor.
Second, these statistics also don’t take into account how much money you’re spending to produce that traffic. If your monthly marketing budget for content, graphic media, promotion, etc. is $2000 all-in, then your business is losing a cent on every visitor (continuing with the previous scenario).
Last, but certainly not least, the big-picture statistics ignore acquisition: i.e. how your traffic performs as a function of where it comes from.
Reddit and Stumbleupon, for example, are notorious for producing high volumes of traffic, but also very high bounce rates and laughably low conversion rates.

That’s because most people who use Reddit and Stumbleupon aren’t actually looking to seriously engage with the websites they visit through those networks.
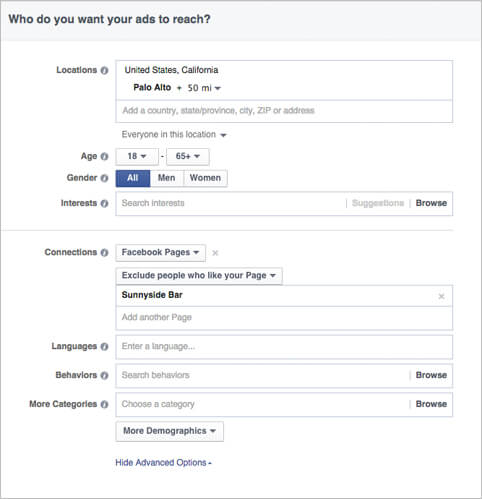
On the other hand, traffic from sources like Facebook ads tends to perform much, much better since Facebook allows you to target their users by age, location, interests, and more.
So while you should definitely pay attention to the overall traffic figures, don’t get too hung up on them. Also, you should realize that these big-picture marketing metrics are not going to give you information you can act on to improve your marketing. That comes when you investigate the following statistics that are much narrower in scope.
Acquisitions
As we briefly touched on above, assessing your traffic according to the channels through which it comes is a crucial step to analyzing traffic appropriately.
For starters, you’ll want to think about the volume of traffic that arrives through each source.
Is social media your biggest driver of traffic? Guest posting? Or do you get visitors the ol’ fashioned way, via organic search rankings?
Once you know exactly through which channels your traffic is coming, you can capitalize on that information by focusing your marketing efforts on the sources that deliver visitors.
For example, if you’re running a fitness blog and you discover that Pinterest and other social networks drive you more traffic than anything else, then you’d probably want to focus on building your social media presence even further.

Another important metric to track with traffic acquisition is the cost of each visitor based on the channel through which it comes.
In keeping with the fitness blog example above, let’s say that you got 10,000 visitors in a month from social media. In that same month, you got 5,000 visitors through organic search. Obviously, social media seems like the traffic channel to focus on.
But now let’s add a new piece of information to the equation: cost. If you spent $500 on social media marketing in that month, then you’re spending $0.05 per social media visitor. And if you spent only $100 on SEO, then you’re spending $0.02 per organic search visitor.
Suddenly working on social media presence doesn’t seem like the best idea, does it? Pursuing more organic visitors would mean more traffic at a lower cost per visitor (which translates to more profit).
Average Time on Site
The average time on site metric is a great way to measure engagement on your site.
This slice of data measures the average amount of time a visitor spends on your site each session.
If each visitor spends only about 30 seconds on your site before hitting the back button, then you know that there’s probably something repelling about your site. Get to work on fixing that.
Bounce Rate & Pageviews per Visit
The bounce rate and pageviews per visit metrics are also important indicators of your traffic’s engagement level.
A “bounce” is a visitor that happens on your website, views only one page, and immediately leaves (there are other definitions of a “bounce”, including one that limits bounces to <30-second, single-page visitor sessions).
Therefore, bounce rate measures what percentage of your visitors view only one page before leaving.
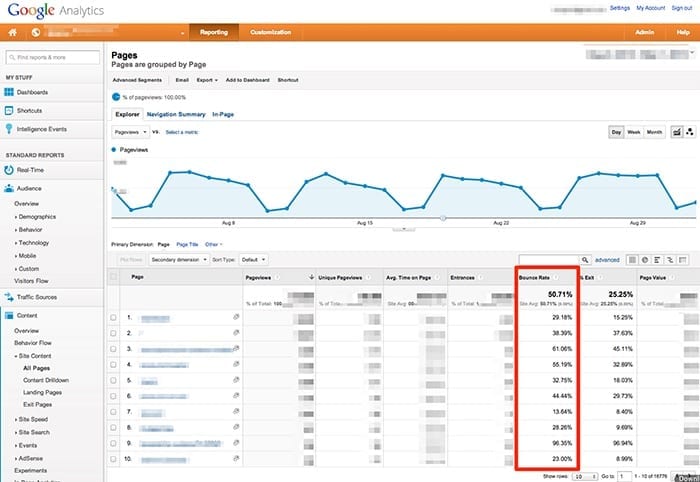
Image via Qualaroo
A high bounce rate is a negative result and definitely something you’d want to improve on.
Pageviews per visit is essentially the other side of the same coin: it measures the average number of website pages each of your visitors browse through in each session on your website. More pageviews per visit mean that your visitors are interested in the content on your website.
Returning Visitors
The returning visitors metric is another type of engagement metric altogether. This metric analyzes what percentage of your visitors are ones that have already browsed your website before.
This statistic isn’t black and white, like some of its predecessors on this list.
As we just discussed, a high bounce rate for instance is obviously bad while a low rate is clearly good.
With returning visitors, however, a super-high or super-low measure isn’t necessarily good or bad.
If a very high percentage of your traffic are return visitors (e.g. >70%), then that means two things: 1) your traffic is engaged with your site, but 2) you have very few new visitors.
The second result – very few new visitors – isn’t a result that you’d want to have, since that puts a ceiling on your growth.
The same is true when you apply the reverse. A very low returning visitors percentage means that even though you are getting new visitors, your traffic is never engaged enough with your site to visit it a second time.
The key, therefore, is to aim for a healthy 50/50 or 60/40 balance.
Email marketing is a crucial element of any successful business. This fact is evidenced by a simple statistic: 44% of email recipients last year made a purchase because of a promotional email (that’s nearly half of everybody who uses email!).
And according to a 2013 study done by the Direct Marketing Association, email marketing has one of the highest ROIs of any marketing strategy: 4000%. That’s $39 profit on every buck spent on email.
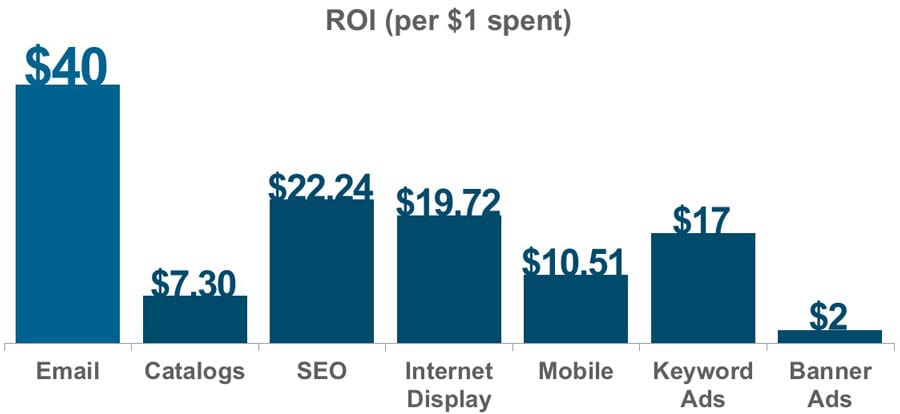
Image via Adobe
But you won’t be getting these sorts of ROI figures by simply setting-and-forgetting an email campaign. To improve the effectiveness of email, you need to track every aspect of your campaign, and use the information you get to continually improve.
Here are a few important email marketing metrics to get you started.
Open Rate
Open rate is one of the most basic email marketing statistics, and an absolute must-know for your campaign.
This metric measures the number of people on your list who open your email. For example, if your latest broadcast got an open rate of 12%, that means for every 100 people on your list, 12 people opened the email.
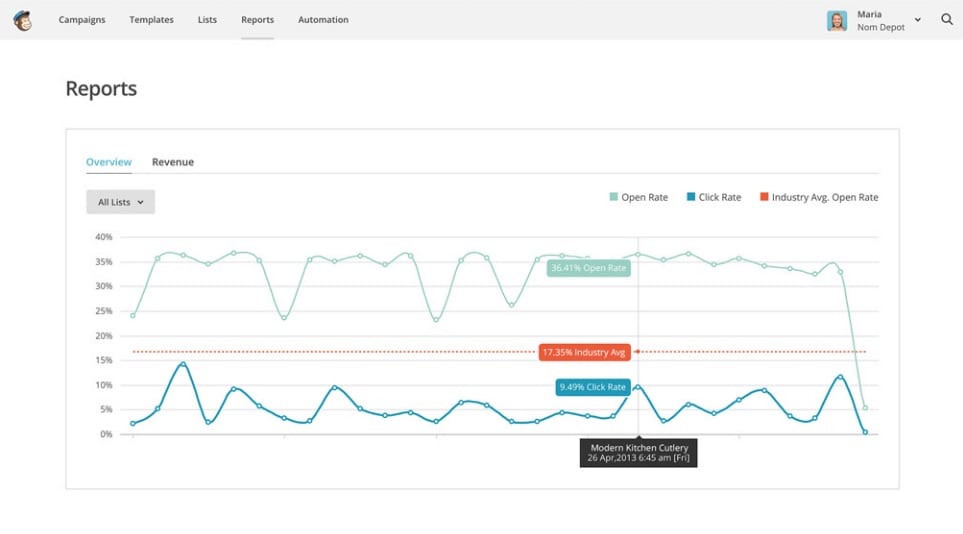
According to benchmarks provided by email marketing vendor Mailchimp, open rates are notoriously low across almost every industry.
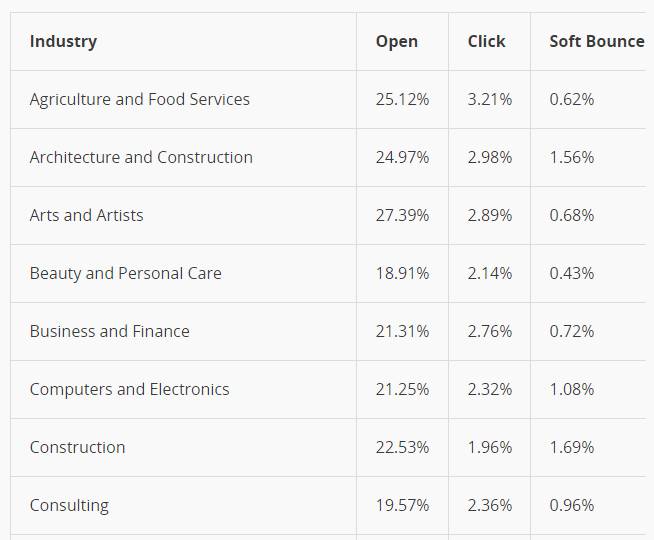
In not even one industry Mailchimp tested did email campaigns get an average open rate above 30%.
If your open rates are significantly lower than that, then it’s time to do something about it.

Test more subject lines, try a more attention-grabbing first sentence, and above all, ensure that your emails aren’t getting redirected to the spam folder.
Click-through Rate
Click-through rate (CTR) refers to the percentage of people who receive an email click one of the links in your email.
As you can see in Mailchimp’s data above, CTRs are usually less than 5%, meaning that for every 100 people on your list less than five are likely to click the links you post in your emails.
One technique you can use to increase your CTR is to repeat a specific link several times within the body of your email.

Neil Patel over at QuickSprout does this in every email he sends out marking the addition of a new post to the blog. He repeats the link to the new post three times from the first sentence to the last.
Unsubscribe Rate
The unsubscribe rate is self-explanatory — it refers to the percentage of people who unsubscribed from your list after reading a specific email.
Typically, a high unsubscribe rate means that there’s something particularly unappealing about your emails. It could be that the content feels too salesy, is properly formatted, or that you email too rarely for your list to remember why they subscribed to you in the first place.
Find out what’s causing the unsubscribes, and work to eliminate that flaw.
Delivery Rate
The delivery rate refers to the percentage of your emails that actually get through to your list’s inboxes. For example, a 99% delivery rate shows that out of every 100 emails you send, one gets stopped by the subscriber’s anti-spam/malware filter.
If your delivery rate is low (less than 95%), then one of the below two reasons are probably responsible:
- You have too many links (esp. affiliate links) in your email/It sounds & looks spammy.
- Your email marketing service isn’t doing a good job.
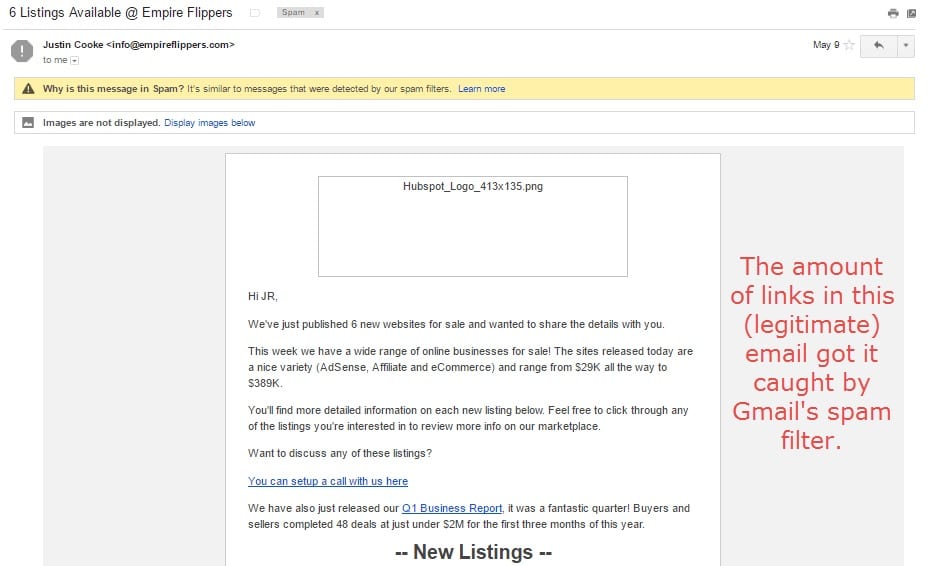
Reason #1 warrants a review of your email campaign.
Reason #2 shows that it might be time to get in touch with your email marketing service. If the problem doesn’t get resolved, then it might be time to switch services altogether.
Conversions
Conversion-related marketing metrics are another highly important category of analytics to pay close attention to.
A conversion is defined as when a website visitor completes a goal action. For example, a visitor could “convert” into a subscriber by accomplish an opt-in goal or a subscriber could “convert” into a customer by completing a purchase-product goal.

Conversion rate, therefore, is essentially a metric of how productive your traffic is. The more conversions your traffic gives you, the more your visitors are doing exactly what you want them to do.
One of the biggest drivers of conversion rate optimization is a/b testing, wherein you sent a portion of your traffic to a certain variant of a webpage and another portion to another variant of the same page to see which variant is most productive.
A/b testing is absolutely vital to increased conversion rates: without it, you simply aren’t going to make any progress on the conversion front.
Here are a few key conversion metrics you need to track.
New vs. Return Visitor Conversion
The first metric to analyze is concerned which of the following groups of your traffic converts more: new visitors who have never browsed your site before, or returning browsers who have already had multiple on-site sessions.
Typically, you’ll find that return visitors are more likely to convert — especially when the conversion in question is a big deal (like purchasing a product or becoming a client).
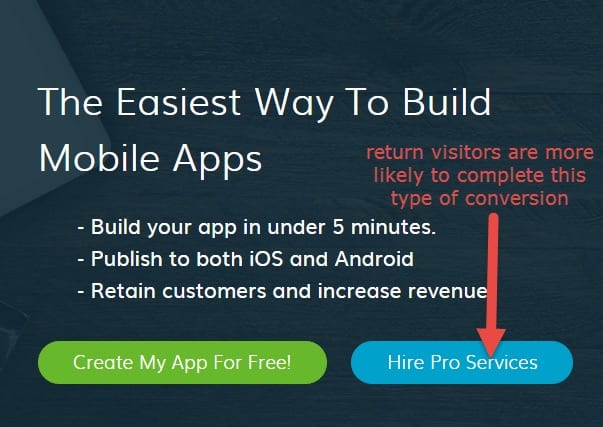
This is a logical result: return visitors are more familiar with your site — and since they’re visiting it multiple times, they obviously find it appealing enough to want to return. Therefore, they’d be more comfortable with spending money on your site.
New visitors, on the other hand, are more likely to convert in other ways. For example, unique visitors may accomplish an email marketing conversion by subscribing to your blog after reading just one post, or they might complete a social media conversion by sharing one of your posts.
Acquisition
Just as with traffic, it’s important to keep in mind the channels through which your conversions come. You should be tracking how much this costs.
PPC and email traffic often convert at much higher rates than traffic from organic search, referrals, or social media, since they are generally much more targeted towards your ideal audience.
Cost per Conversion
Once again, cost is a major metric to track. You should be able to tell approximately how much you’re spending on each conversion.
You will probably have to look at the conversion acquisition channels data to get a good indication of this metric.

Image via Ryan Gum
If you spent $500 on PPC traffic last month and got 250 conversions from PPC traffic, then you’ve got a cost per conversion of $2. Obviously, your target is reduce this number as much as possible, while still maintaining conversion quality and value (see below).
Conversion Value
Another conversion statistic to keep in mind is the value of each conversion (i.e. the impact of each conversion on your bottom line).
This metric may not be so cut-and-dried as you think.
Obviously, the easiest type of conversion to ascertain the value of is a sale. If the target conversion is the purchase of a $50 product, then the value of that conversion is $50. However, you can also assign values to either types of conversions, like email list subscriptions.
For instance: if approximately 10% of your list goes on to become customers (spending $50 on your product), then each time you get a new subscriber you effectively add $5 to your bottom line.
Customer Activity
You may be a little confused at first by this category of marketing metrics, as it’s not one that gets mentioned very often, for a simple reason. Because measuring customer activity doesn’t always produce tangible results like most of the other analytics, it isn’t a very ‘fun’ one to focus on.
But nevertheless, tracking levels of customer activity is absolutely crucial to your business.
When I say customer activity, I’m essentially referring to how your customers interact with your business after having become a customer.
Now why is it important to keep your customers engaged after they’ve already become your customers? After all, they’ve already bought one of your products/produced money for your business, so they are pretty much useless now, right?
Wrong.
Two words: repeat sales.
Repeat sales — i.e. where a customer buys a second or third product/service from you — will easily be one of the biggest drivers of revenue for your business.
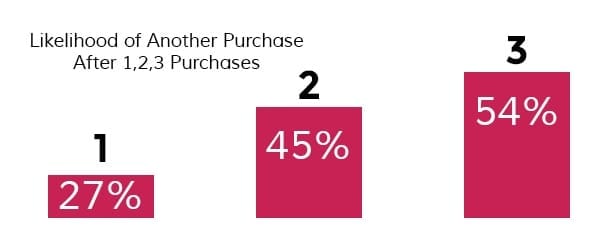
Take a look at the above graph from Sweet Tooth Rewards. It shows how on average, 27% of first-time customers are likely to buy from you again. 45% of second-time customers are likely to buy again. And 54% of people who have purchased something from you at least three times are likely to spend more money with your business (and on the trend goes).
So in short, someone who’s already become your customer is far more likely to give your business more money in exchange for goods/services than some random website visitor who’s never bought from you before.
The buy-again potential of customers is largely untapped in the online business world. Many marketers forget that the most productive source of new sales is often their existing customer base.
But you won’t get very many of your customers to buy from you again if you aren’t working to keep them engaged and continually interacting with your brand.
In the following sections, we’ll take a closer look at what sort of customer-brand interactions you ought to track.
Social Media Engagement
Social media is a great way for your customers to interact with your brand, for two reasons:
- It’s ubiquitous — nearly two thirds of the US is on social media, according to Pew Internet
- It’s an easy tool to use — customers can tweet, write a Facebook post, or publish an Instagram image in just a few seconds.
Track how much your customers use social networks to engage with your brand. You can monitor mentions of your social media page, brand-related hashtags, and the effectiveness of your social campaigns among customers.

Of course, to keep your customers engaged on social media, your business itself must have a strong social media presence. If you don’t have one already, then Jamil’s post on strategies for social media success is definitely a must-read.
Email Engagement
Yep, we’re back to email.
When a visitor turns into a customer, they should immediately be put on an email list that’s designed and segmented exclusively for customers.
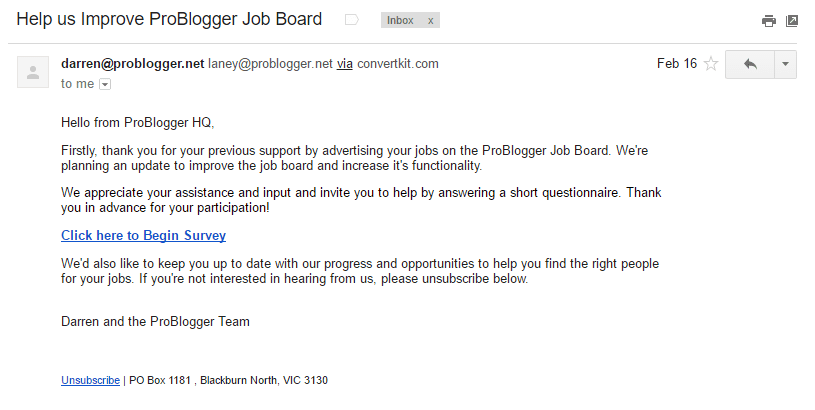
For example, here’s an email from Darren Rowse at Problogger that’s sent exclusively to the customers who have used his job board.
This customer-targeted email list can typically be a little bit more salesy/promotional than your other campaigns; as we discussed above, customers are quite likely to buy from you a second time, so don’t be afraid to push for a sale.
Track how often customers are opening emails, clicking through the links, and unsubscribing.
Onsite Activity
Another important metric to keep track of is how your customers continue to interact with your site. Are they still reading your blog posts and perusing your about page as they were before the sale? Do they spend more time on your landing pages and product pages? Or are they (gasp) not visiting your site anymore at all?
If your customers are still engaging with your site even after the sale, then that’s a good sign that they still have an interest in your business and may possibly spend more money on it in the future.
On the other hand, if a customer is completely abstaining from heading to your site again, then one of the two following reasons are probably responsible for that:
- They got what they needed, and now have zero interest in engaging with your brand again.
- They wouldn’t mind checking you out again, but you haven’t given them a reason to.
In scenario #1, there’s nothing you can do except accept the fact that customer was a one-and-done type of guy/gal.
In scenario #2, you need to work harder to re-engage the customer.

Try dropping him/her a special email to check how the product is working, or send out a quick tweet directly to the customer to start a conversation (see above).
Bottom Line
Finally, we have bottom line metrics.
Unsurprisingly, bottom line metrics are all about your bottom line. This category of metrics is concerned with the most major performance indicators in all of business: revenue, costs, and profit.
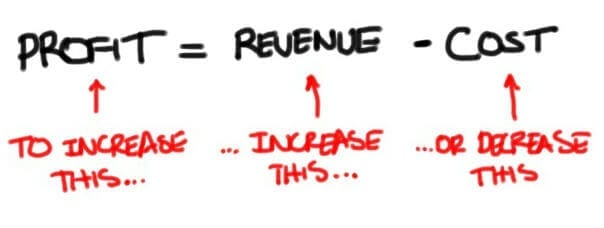
Image via Danube Delta Investment
Revenue
First up is revenue. As you already know, revenue is the aggregate sum of money that you make from your business.
This includes money from customers & clients, advertising, affiliate marketing, or whatever other income streams that you may employ in your online business.
Costs
The second metric is costs. Now, when most people think of costs they think strictly in dollar terms. For example, a list of costs might include things like the following:
- Website-related services: $500/month
- Marketing: $2000/month
- Product development: $2000/month
- Accountancy & bookkeeping: $500/month
- Legal fees: $1000/month
- etc.
However, the one cost that most people tend to overlook is time.
Time is always more valuable than money, and entrepreneurs are among some of the most time-poor people in the world.
When you’re busy growing your business, don’t forget to take into account how much time you’re spending on your work.
For this purpose, I’d recommend a time-tracking app like Toggl.
![]()
This neat webapp (which I personally use just about every day) allows you to quickly and easily track how much time you’re spending on each part of your project in a smooth, intuitive UI.
Profit
Last, but certainly not least, we have profit, which is revenue – costs.
As the founders of startups, you’re all no doubt experienced with being in the red early on.
After all, the costs associated with building an online company — although they may be far from the costs of building an offline one — certainly are nothing to sneeze at.
The key here is to realize and accept that you may not be profitable for a while. Amazon, for example, is still be in the red. However, with its continual growth, the eCommerce giant geared to make bucketloads of money when it does hit profits.
Marketing Metrics Tools
Now that we’ve finished talking about what you should track, let’s get into the how.
Note that marketing metrics tools come in many different forms, perform many different functions, and are categorized in several different pricing tiers. You have tools dedicated for email stats, conversion analytics, bottom line metrics.
You have tools that cost $0 to use, and you have tools that can run in the mid four-figures every month.
In this post, we’ll cover a few tools at different price points for each of the five categories of marketing metrics that we’ve just discussed.
Traffic Marketing Metrics Tools
Google Analytics
Google Analytics is the undisputed king of web analytics. Used by people all over the world, Google Analytics is powerful, versatile, and as an added bonus, totally free.
There are no hidden upsells or upgrades that you need to pay for access to — everything you will need on the platform is 100% free of cost.
Integrating the platform with your website is as easy as adding a few lines of tracking code to your website. If you’re on WordPress, then that process is as simple as a few clicks with the free Google Analytics by MonsterInsights plugin.
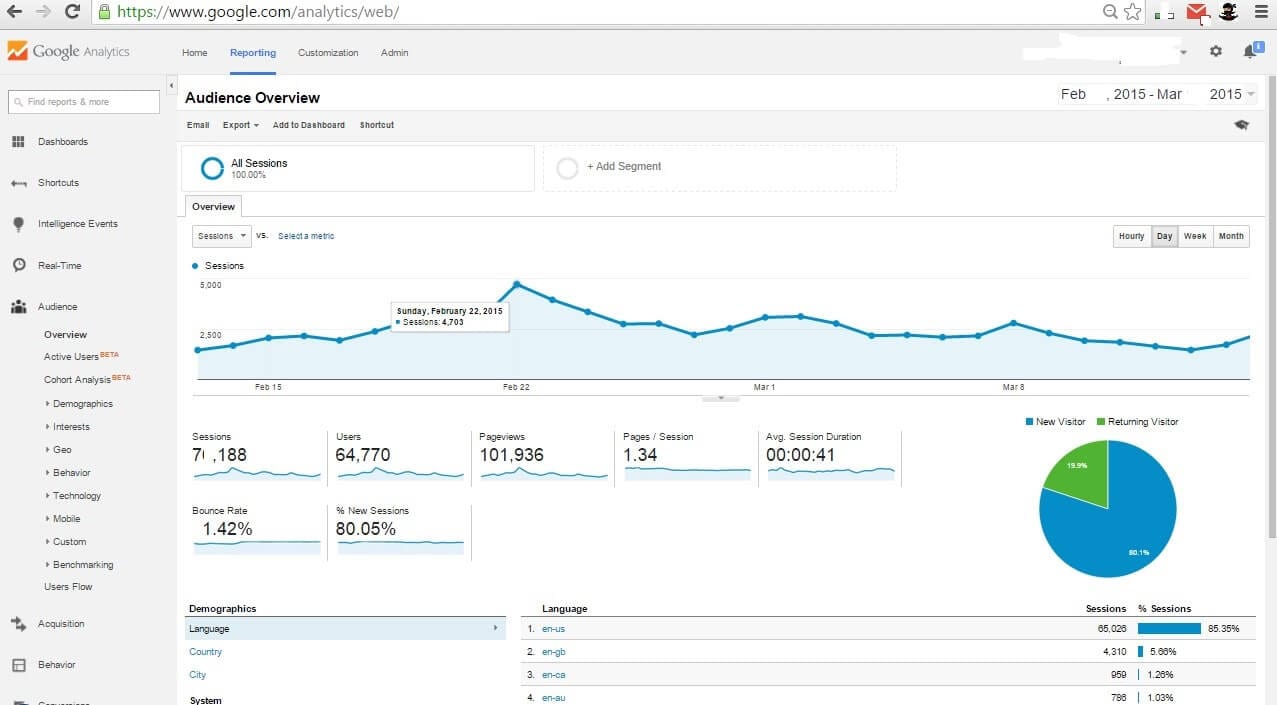
Image via Content Marketing Institute
Google Analytics isn’t limited to just traffic metrics, either: it also has some neat conversion-tracking functionality built-in as well. You can track goal completions (conversions) and also assign values to each conversion so you can visualize the amount of money made in each conversion as well.
Clicky
Clicky is another highly popular web analytics tool. Unlike Google Analytics, Clicky does have paid plans — if you want to track more than 1 site and/or more than 3,000 pageviews per day, then you’re going to have to shell out at least $9.99/monthly.
However, Clicky does come with great bang for your buck. It’s real time data is much better than GA’s, and it has more detailed information about each visitor that comes across your website (see below).
It also features heatmaps that show you where visitors click on your pages, spam/bot filtering, an upgraded bounce rate metric, dynamic conversions (that don’t have to be pre-defined) and much more. You can see a tabular comparison of Clicky and GA here.
If you want to learn more about Clicky, read Ramsay’s full review at Blog Tyrant.
Mixpanel
Mixpanel is a fully-featured analytics tool with a lot to offer. It’s targeted at a more premium customer base (paid plans start at $150 monthly), although it does included a very limited free plan.
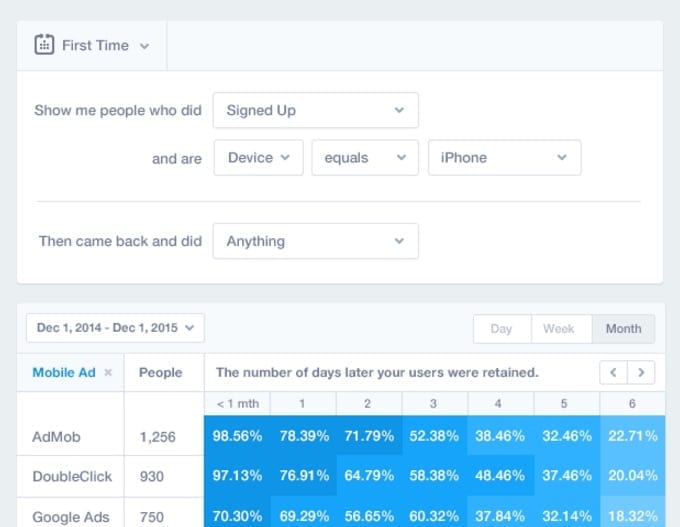
The tool features segmentation, retention, funnel, and engagement analytics, as well as built-in A/B testing and notifications for the front end user. If you have the budget, then Mixpanel should definitely be near the top of your list.
KISSmetrics
KISSmetrics has built up quite a name for itself in the online marketing industry with its terrific content strategy that includes a (very) popular blog, comprehensive e-business guides, and regular webinars.
KISSmetrics is pretty much on an even keel with Mixpanel. They both mostly have the same features, and both have similar pricing (KISSmetrics starts at $120/month and Mixpanel at $150/month).
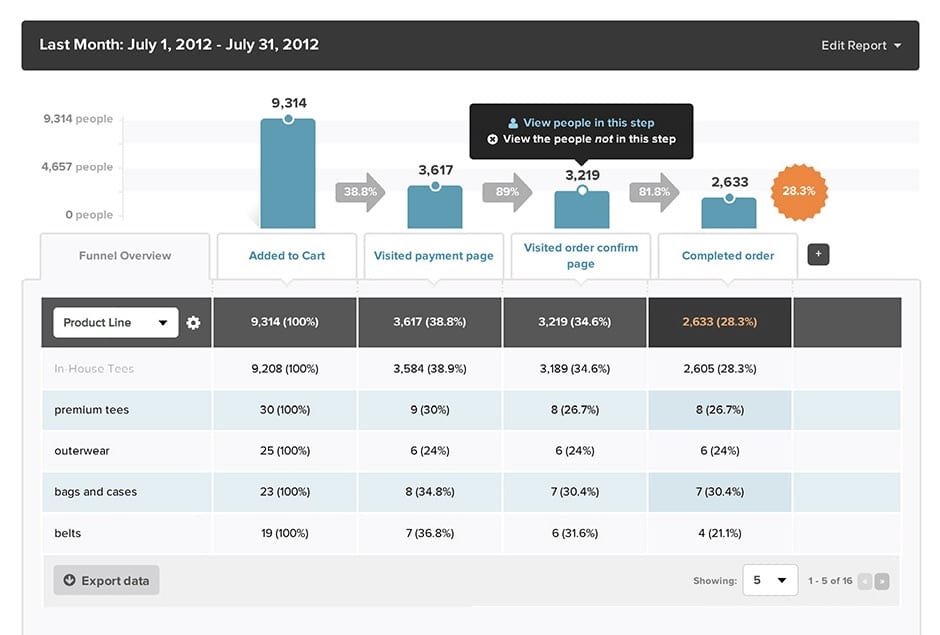
A review of both platforms by Sacha Greif came to the following conclusions:
- Go with KISSmetrics “if you want to focus on attracting people”
- Go with Mixpanel “if you’re more interested in tracking trends and applying formulas”
Email Marketing Metrics Tools
Mailchimp
Mailchimp is easily one of the most popular premium email marketing tools. It’s very budget-oriented: the tool is free for up to 2,000 subscribers and 12,000 emails per month. However, the free plan does mean a limitation in the available feature set.
Premium plans start at $10/month. Features include integration with several eCommerce softwares, an intuitive email editor, automation workflows, and mobile options.
TJ’s review of Mailchimp at Small Biz Trends offers a comprehensive overview of the tool.
Vero
Vero is a more premium option for those who have the budget. It starts at $99/month for 12,500 subscribers and 25,000 emails/month, but the impressive feature list makes the cost worthwhile.
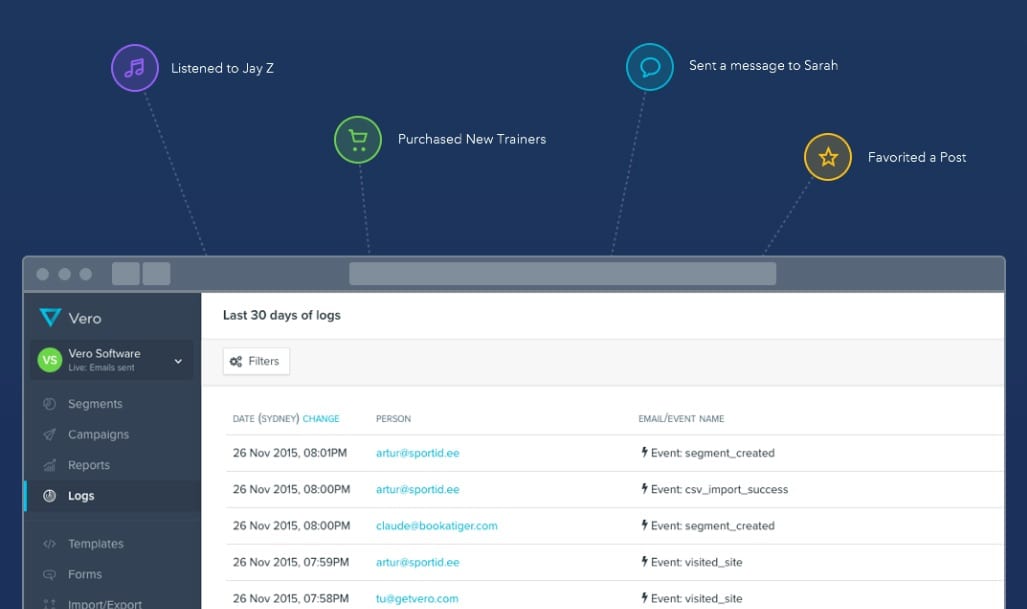
Comprehensive reports on every subscriber’s activity, A/B testing functionality, powerful automation ability, and a sleek UI all make for a killer combo.
Here’s a comparison of Vero with two other popular drip email marketing tools published on LinkedIn.
Conversion Metrics Tools
Google Content Experiments
Google Content Experiments is a built-in part of Google Analytics, but it doesn’t function the same way as do the other conversion optimization & tracking tools available.
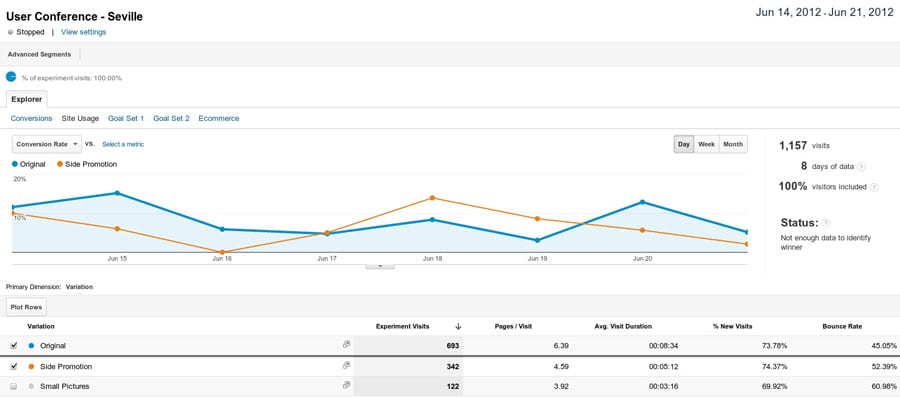
Image via Rich Page
Unlike traditional conversion testing tools that allow you to a/b test variations of the same webpage, Content Experiments actually sends traffic to two separate URLs to see which page converts better. This isn’t as handy as the tools that allow you to test on a single URL, but that’s the sacrifice that comes along with a $0 price tag.
Visual Website Optimizer
Visual Website Optimizer, commonly referred to as VWO, is a popular conversion testing tool with appreciable functionality. The tool comes with an easy to use website editor, detailed reporting, heatmaps, traffic segmentation, and multiple third-party integrations.
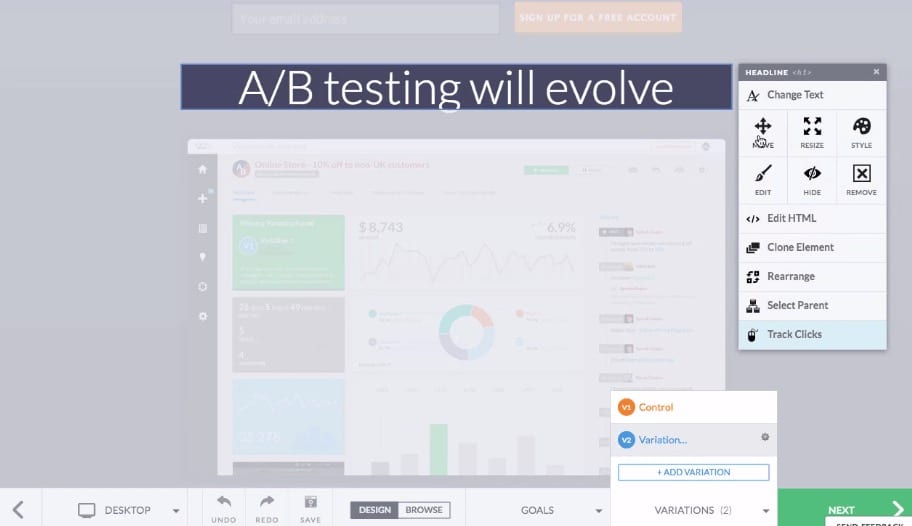
Starting at $49/month for 10,000 tested visitors, VWO certainly isn’t cheap, but its snazzy UI and reporting ability merit the pricing.
If you want to learn more about VWO, check out Rich Page’s review.
Customer Activity Metrics Tools
The best type of tool to use to measure customer activity is a CRM. These tools can track each visitor’s individual actions on your site, right from their first session to their post-sales activity.
CRMs also often come along with many other features, including marketing automation functionality like overall traffic analytics, email marketing, and conversion rate optimization. So if you do decide to go with a full-featured CRM, keep in mind that a lot of the above tools will be redundant.
ActiveCampaign
ActiveCampaign is quite popular with small businesses, and for good reason: it packages into email marketing, automation workflows, and a nifty CRM into one affordable solution.
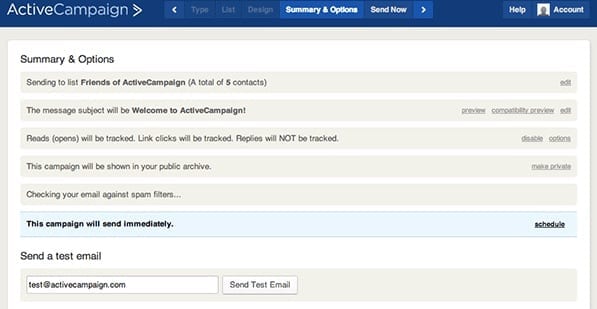
The tool starts at just $9/month for up to 500 contacts (comes with a two-week free trial), and is well known for its premium customer support. I’ve used the tool extensively myself and have always found it super-simple to navigate and altogether quite easy to work with. If you’re on a budget, then ActiveCampaign is probably the way to go.
In this post, Carl Taylor details why he moved over to ActiveCampaign, and why he thinks you should, too.
Infusionsoft
Infusionsoft is well-known in the online marketing space, but its high pricing point can be a turn-off to many. Infusionsoft’s cheapest plan starts at $199/month, and all plans require purchase of a “kickstart” (customer onboarding), which begin at $699. That makes the minimum spend upfront about $900, which is quite a daunting sum for many.
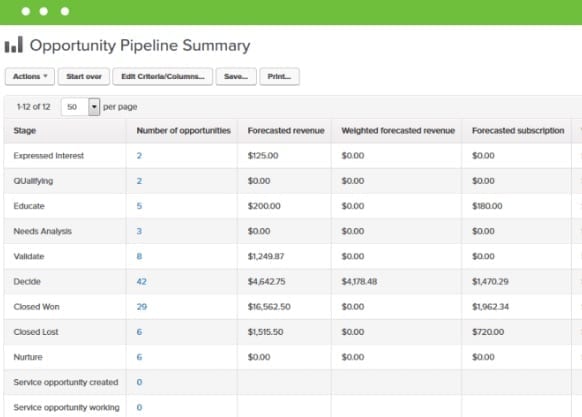
However, if you can afford the tool, then it’s hard to make a case against it. Infusionsoft features a full suite of CRM and marketing automation functionality: detailed analytics, close interaction with contacts, payments, multiple integrations, and oh-so-much more.
Here’s Seth Ellsworth’s take on the tool.
Bottom Line Metrics Tools
Baremetrics
Baremetrics is an affordable income tracking tool specifically for SaaS business. It creates detailed analyses of some of the most important cash flow metrics through integration with Stripe.
Unfortunately, the only thing that Baremetrics cannot take into account is cost, so you don’t end up with an overall profit/loss picture. But regardless, it’s still a highly useful tool.
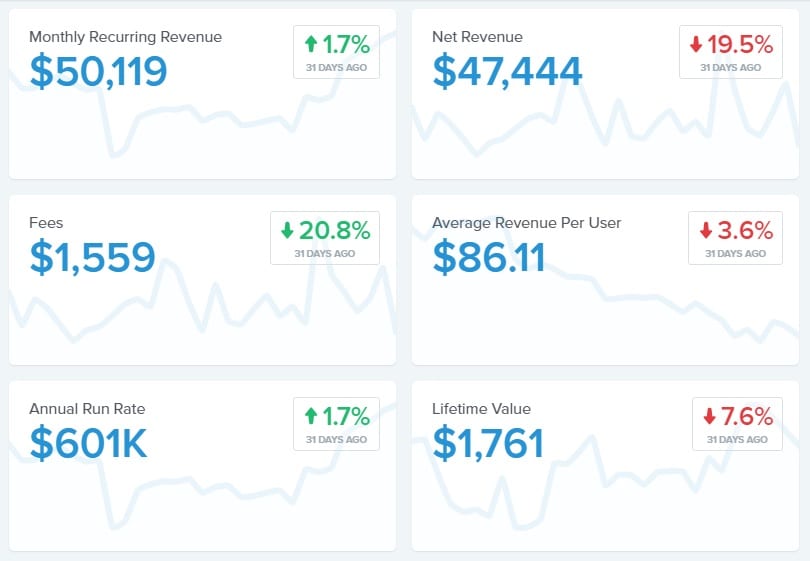
As seen in the screenshot above, the founder of Baremetrics, Josh Pigford, publicly displays the company’s own bottom line figures with the use of a public Baremetrics dashboard that you can view here.
Pricing is based on your monthly run rate, and starts at $25/month for a $2500 MRR. All plans include email reports, instant notifications, goal analysis, and more.
Pulse
Pulse is a neat cash flow management app that was created by a small business, for small businesses. Unlike Baremetrics, Pulse does come with the functionality to report costs & expenses so you have a great overall picture of your business’s performance.
The app allows you to import income and expenses from external sources, choose between one-time and recurring items, and project future cash flow based on previous payments.
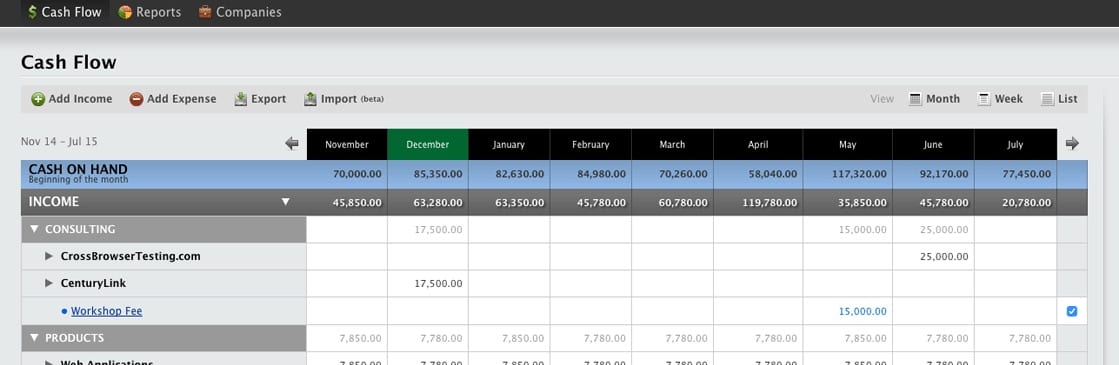
You can test it out with a 30-day free trial, after which it’s only $14/month for up to 3 accounts, 3 users, and 3GB file storage.
Conclusion
And there you have it — the beginner’s guide to marketing metrics.
This one has been quite a long read, so let’s take a moment to quickly recap the post in a few bullet points:
The five major categories of metrics:
- Traffic — look at the big picture, but don’t ignore the narrow-scope metrics like acquisition and engagement indicators
- Email — always track open rate, click-through rate, unsubscribe rates
- Conversions — investigate the best sources of low-cost, high-value conversions
- Customer activity — track how your customer interacts with your business through social media, email, and your website so you know how to get more value out of each one
- Bottom line — carefully account for your revenues, costs, and overall profit
And the best tools for each type of metric:
- Traffic — Google Analytics, Clicky, Mixpanel, KISSmetrics
- Email — Mailchimp, Vero
- Conversions — Google Content Experiments, VWO
- Customer activity — (use fully-featured CRMs) ActiveCampaign, Infusionsoft
- Bottom line – Baremetrics (for SaaS companies), Pulse
Remember: all of these types analytics are critical for your business. You’ll never achieve the full potential of marketing metrics without using all of the above in conjunction.
It’s time to get tracking!
How do you use marketing metrics to grow your business? Dso you have any tools you’d like to recommend? Leave your comments below!